The Flower and the Future
I gave this talk on 15th March 2018 at This Happened London #27: Colossal Dust: Practices of Obsession and Investigation, curated by Marion Lagedamont and Rosie Allen.
My current research is a critical investigation of algorithmic prediction. As a designer, my way of approaching this is through diagrams. The mathematics of prediction are deeply spatial and diagrammatic; they construct multi-dimensional vector spaces from numbers. Predictions are basically operations performed on this space: reducing it, expanding it, cutting through it by drawing lines, smooth curves, planes, hyper-planes, and so on. When you hear the words “Machine Learning” or “Artificial Intelligence” they basically mean very sophisticated diagrams. Hopefully this will become a little bit clearer as I talk through the history of one example.
I am going to start by talking about some iris flowers that were measured in 1936. I will then move to today and how these flowers have been enshrined in prediction mythology. I will finish by zooming out again to show how this is just one example of my bigger obsessive practice of mapping the history of prediction.
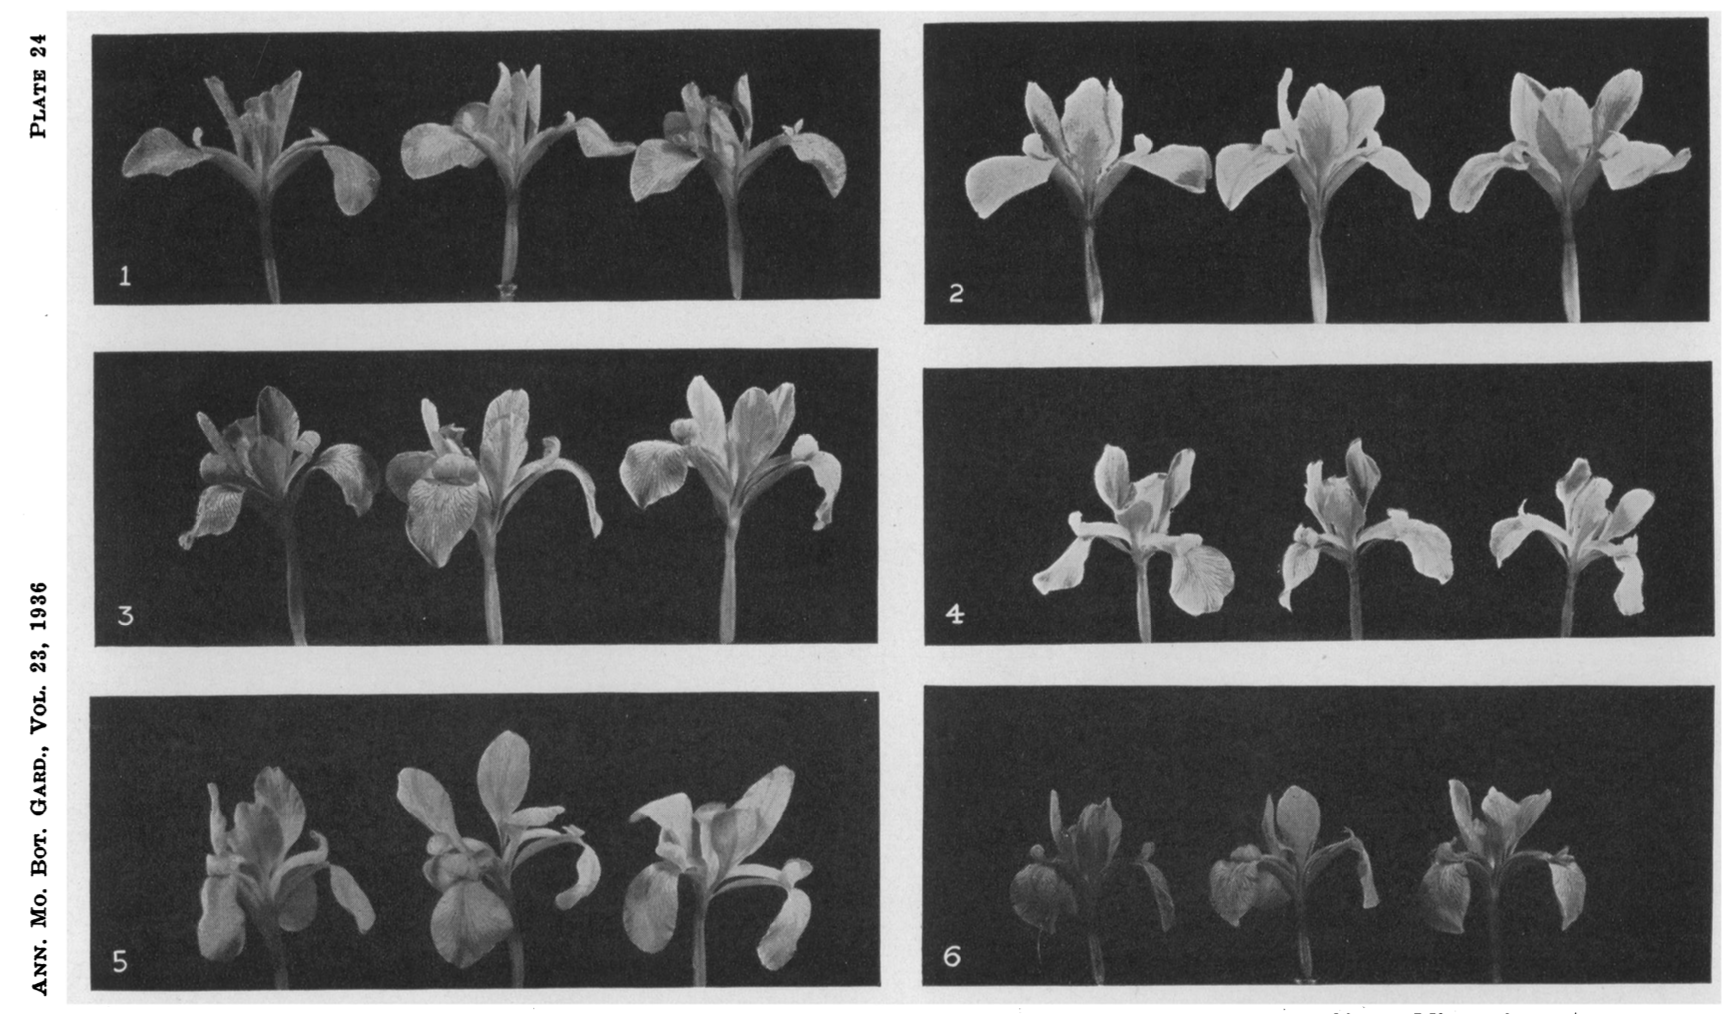
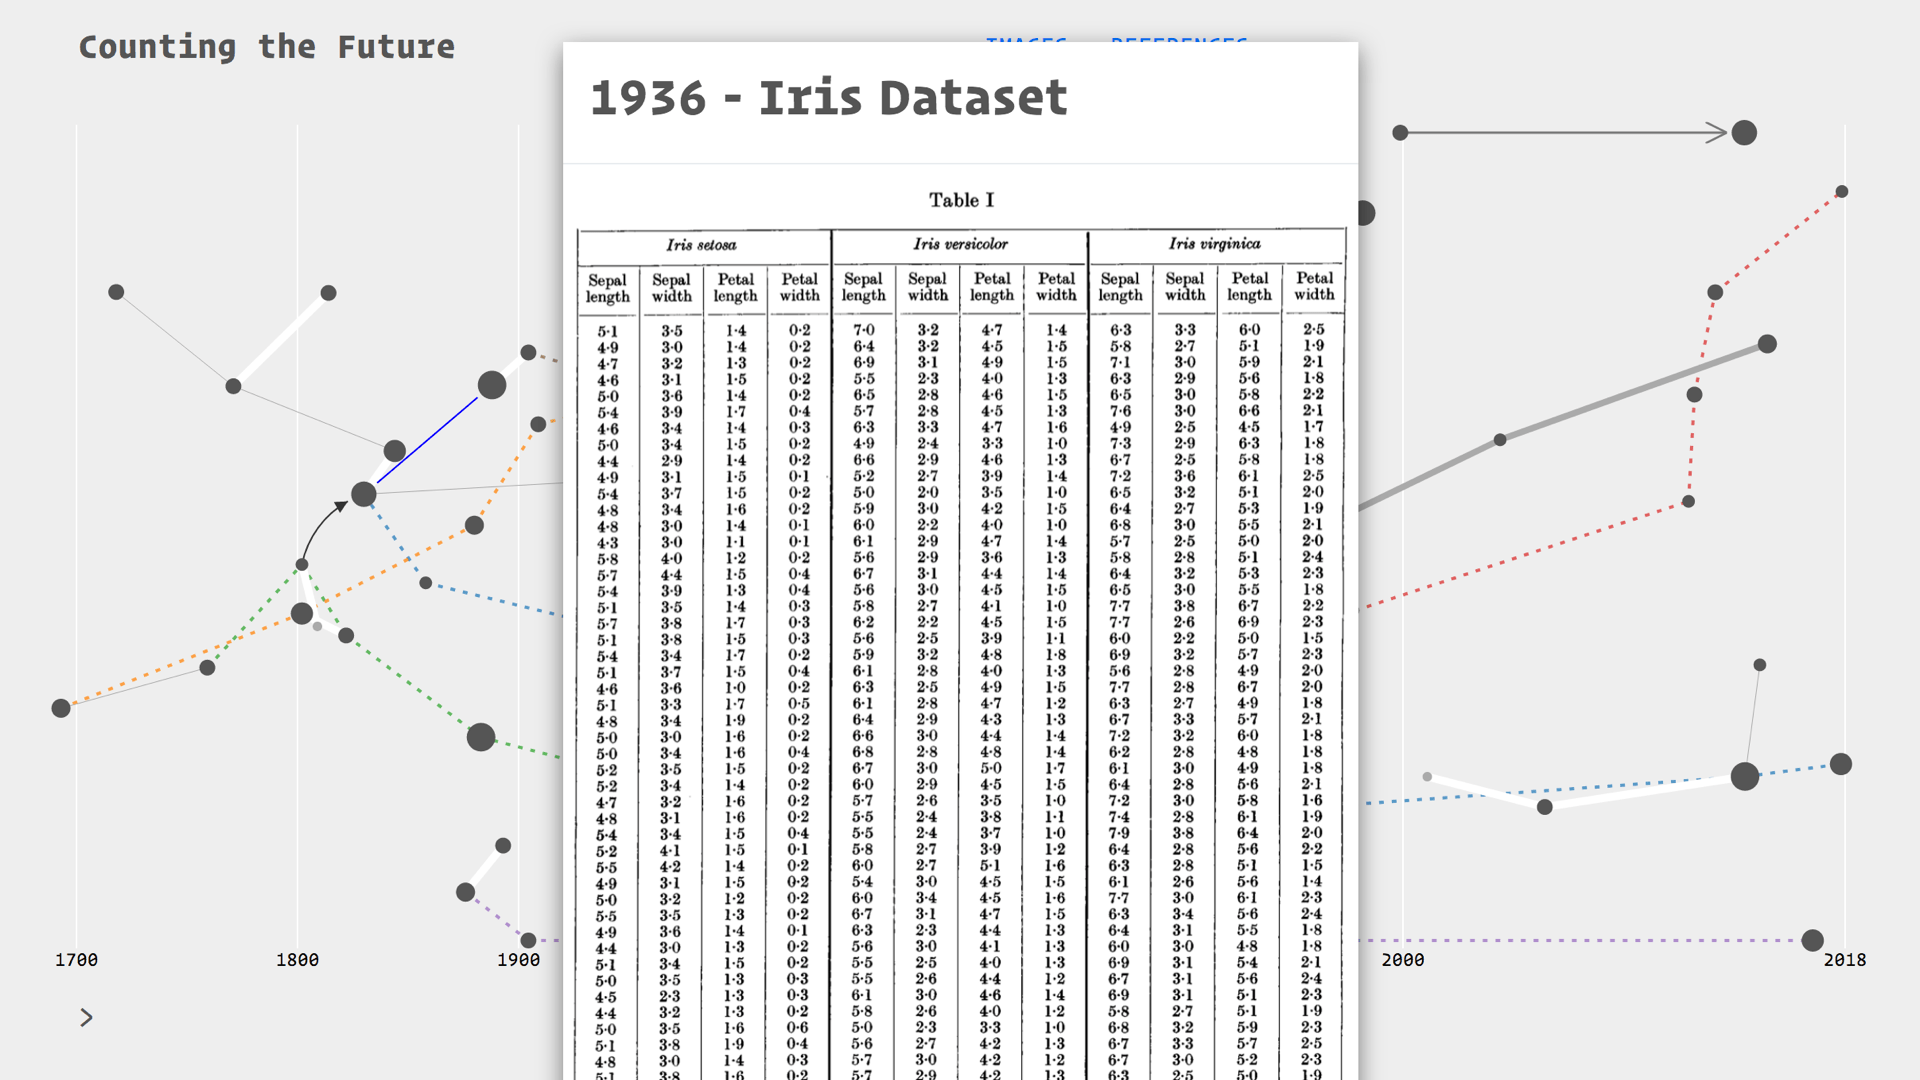
In 1936, Edgar Anderson, a geneticist and professor of botany, was trying to figure out the species problem in iris flowers.1 He was trying to understand the genetic relationships between three sub-species of Iris: Versicolor, Virginica, and Setosa. He suspected that Versicolor was a hybrid of the other two.
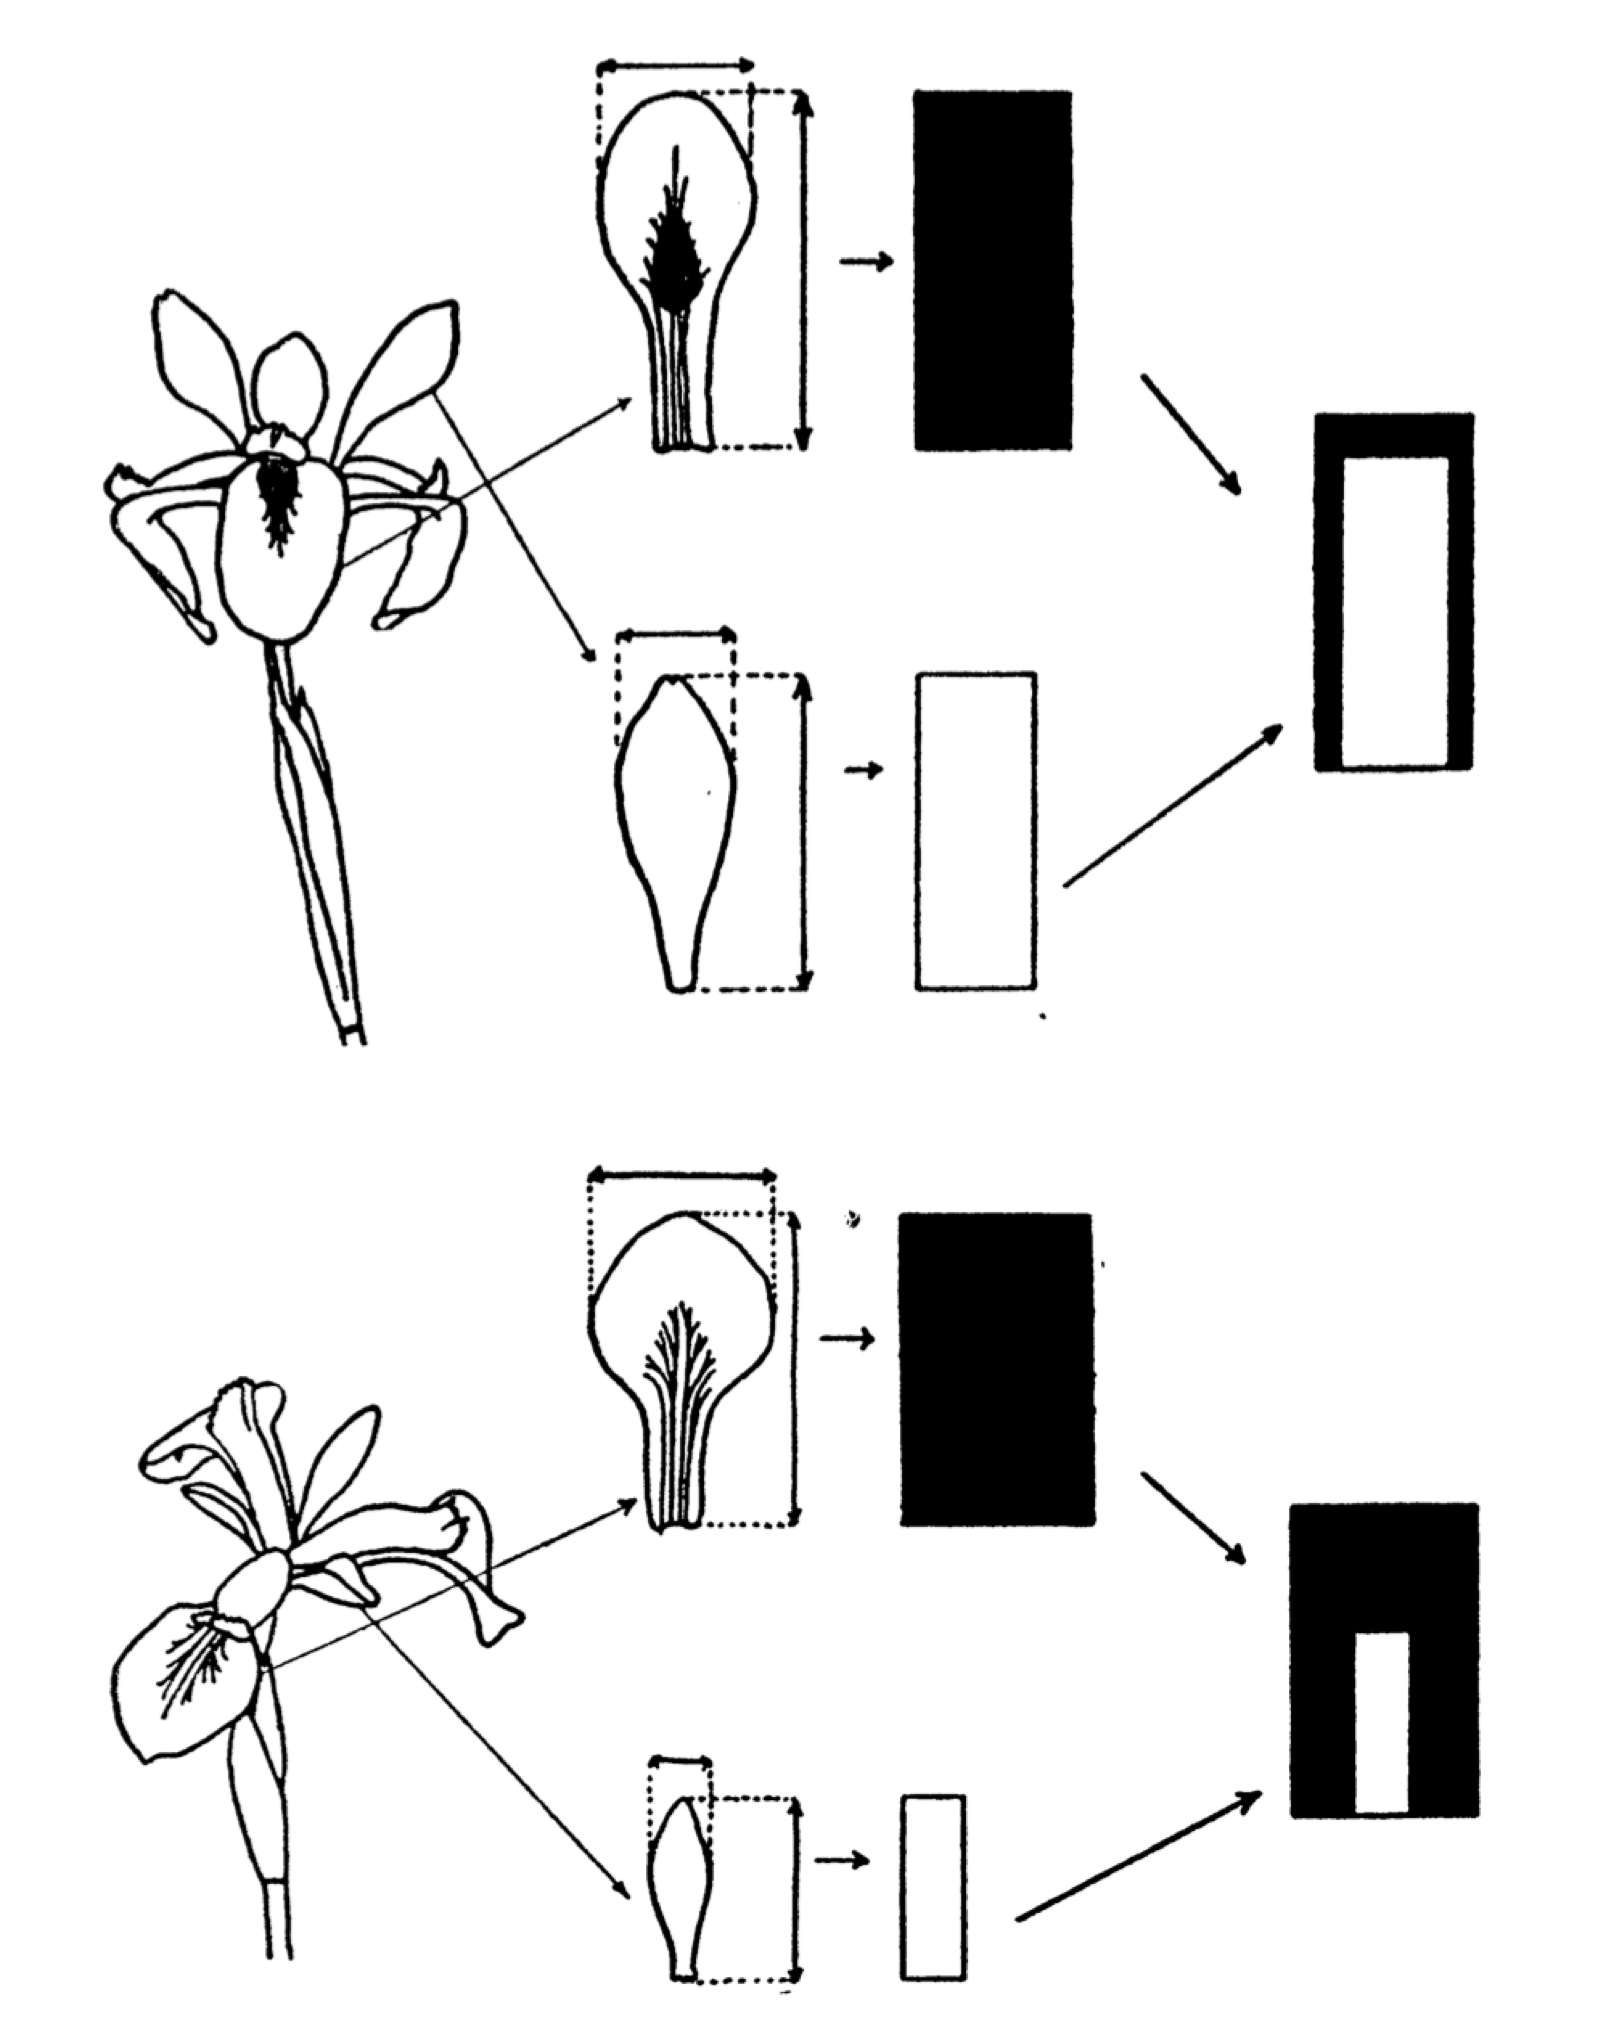
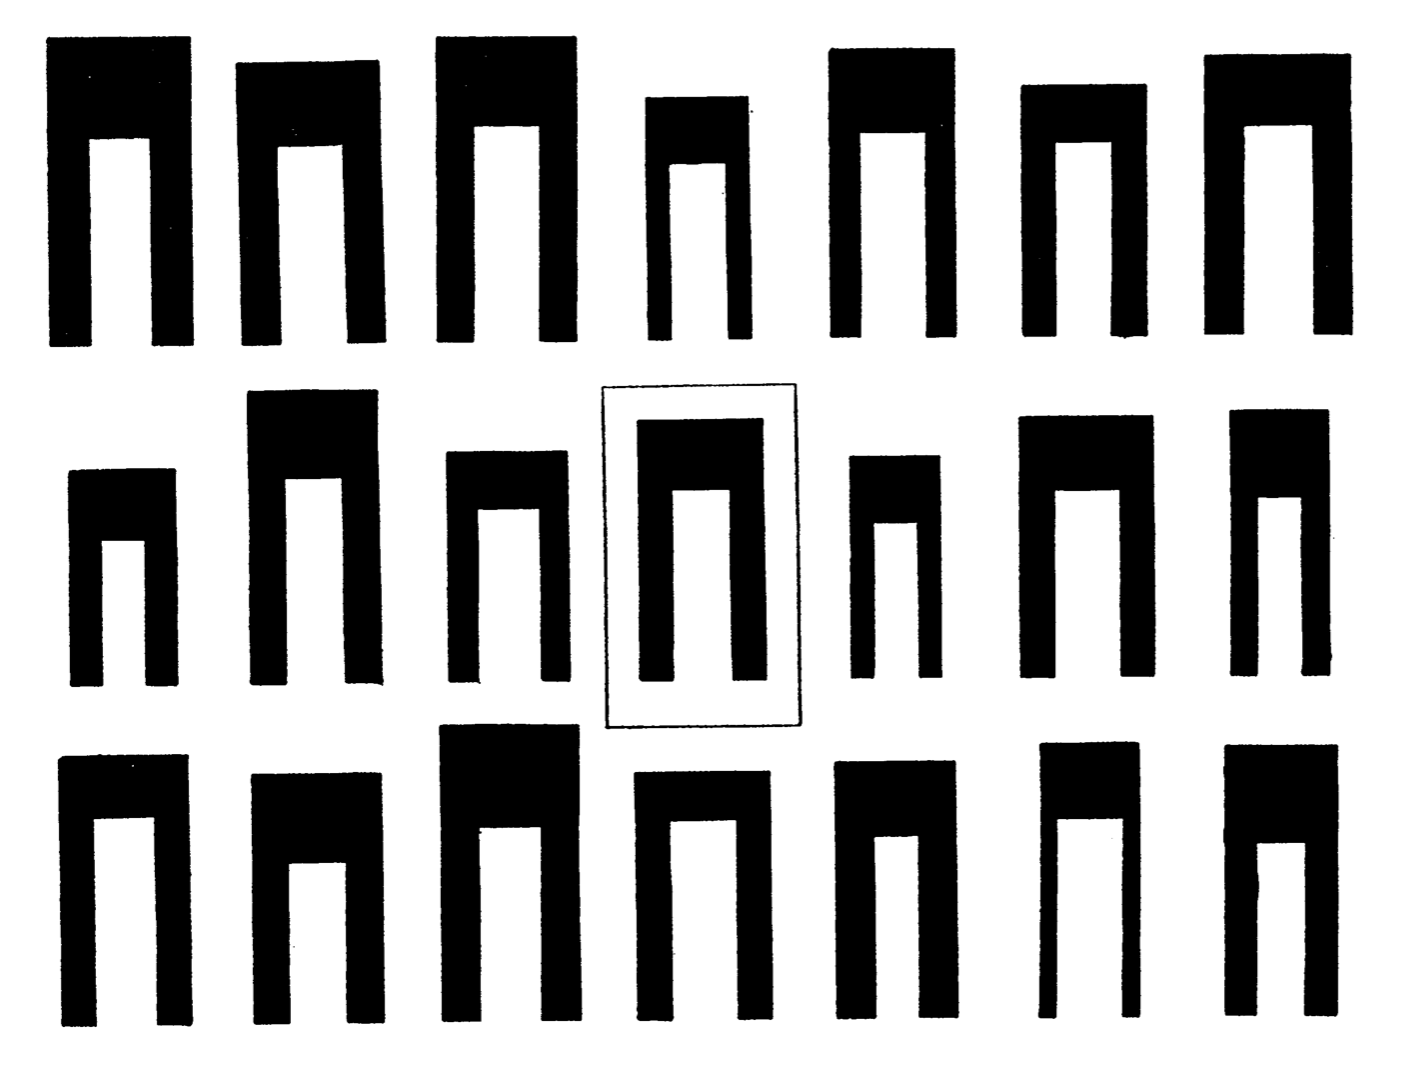
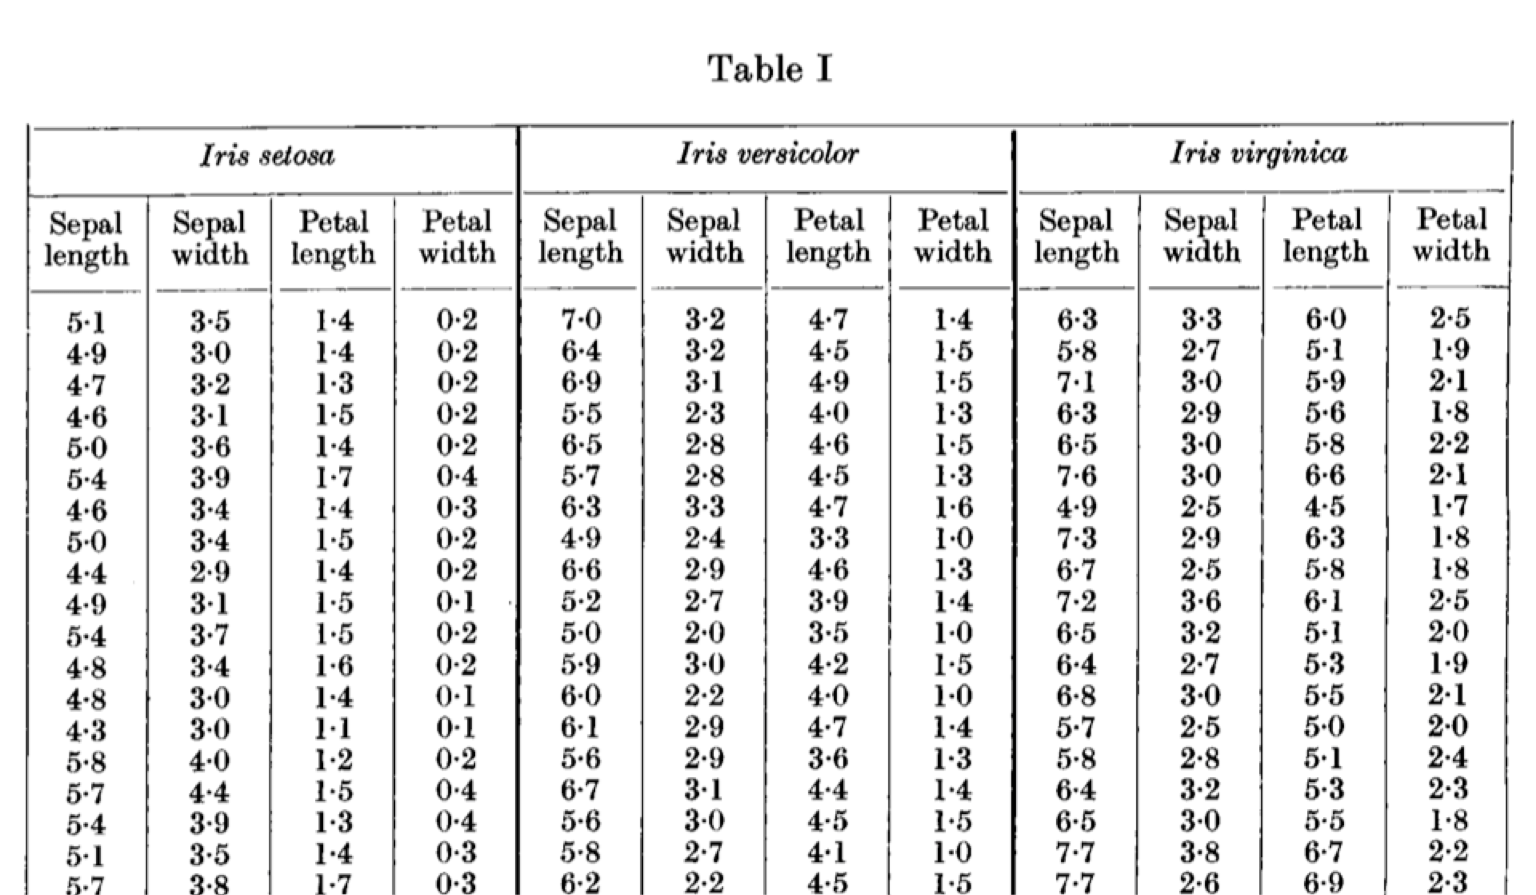
He conducted a study, measuring the petals and sepals of the flowers. He summarised the measurements of each flower in ideographs. Here is our entry point into vector space, this is the last time we will see an actual flower in this talk.
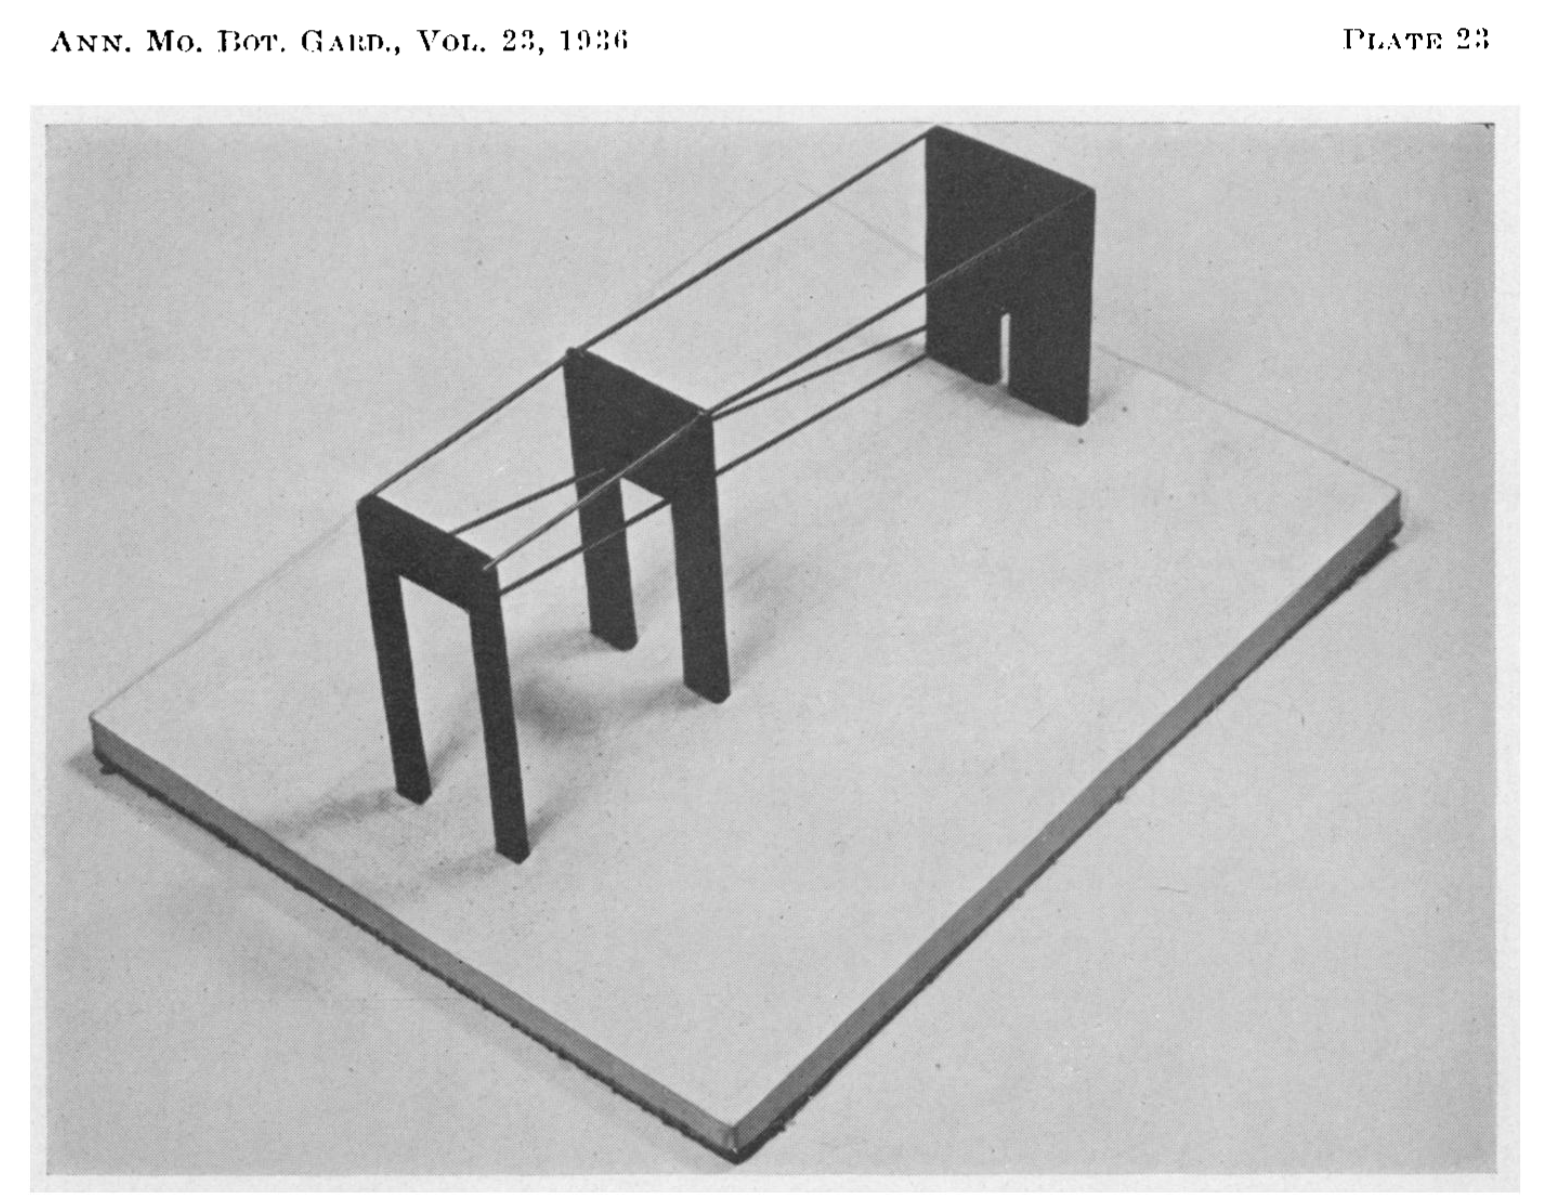
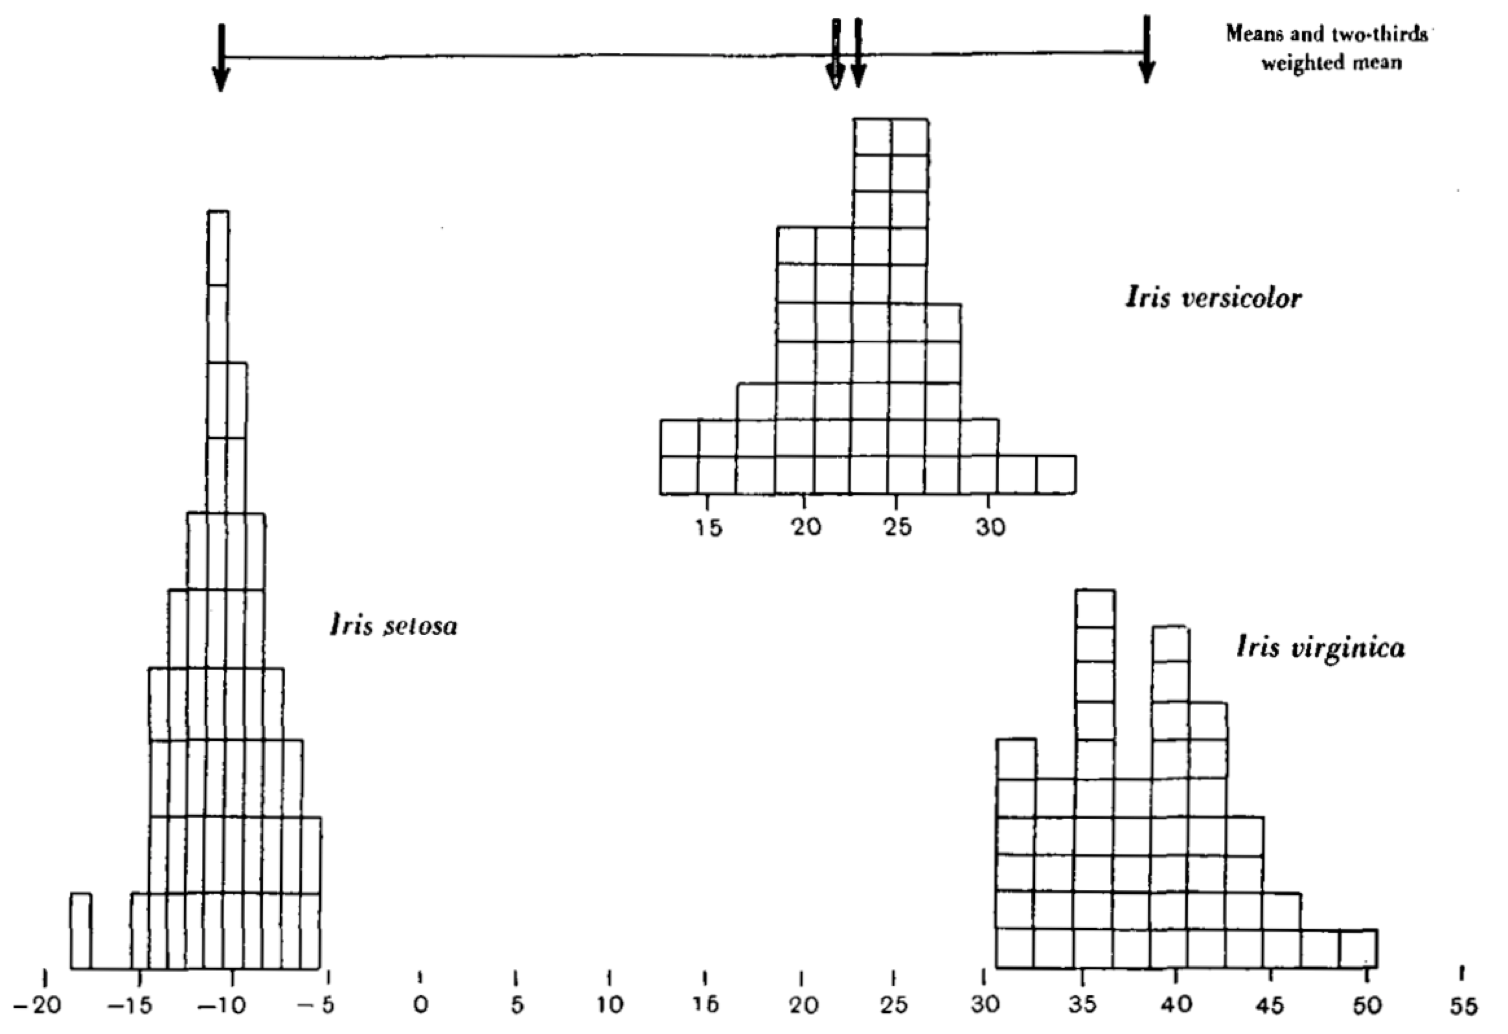
Anderson demonstrated the genetic relationship between the species using a 3D model. Versicolor was indeed between Setosa and Virginica, it was even positioned 2 thirds of the way towards Virginica. In this example, the space’s coordinates are defined by the characteristics (length of petals and sepals) and each species is a vector. Their position in the space tells us something, for example that Versicolor is a hybrid, and that it has twice as many chromosomes from Virginica.
The real fun, however, started a year later. R. A. Fisher, a statistician involved with the study, published his own use of the data.2 He was less interested in the flowers themselves than with finding statistical ways of classifying the species.
When two or more populations have been measured in several characters, x1, ..., x8, special interest attaches to certain linear functions of the measurements by which the populations are best discriminated. (Fisher, 1936)
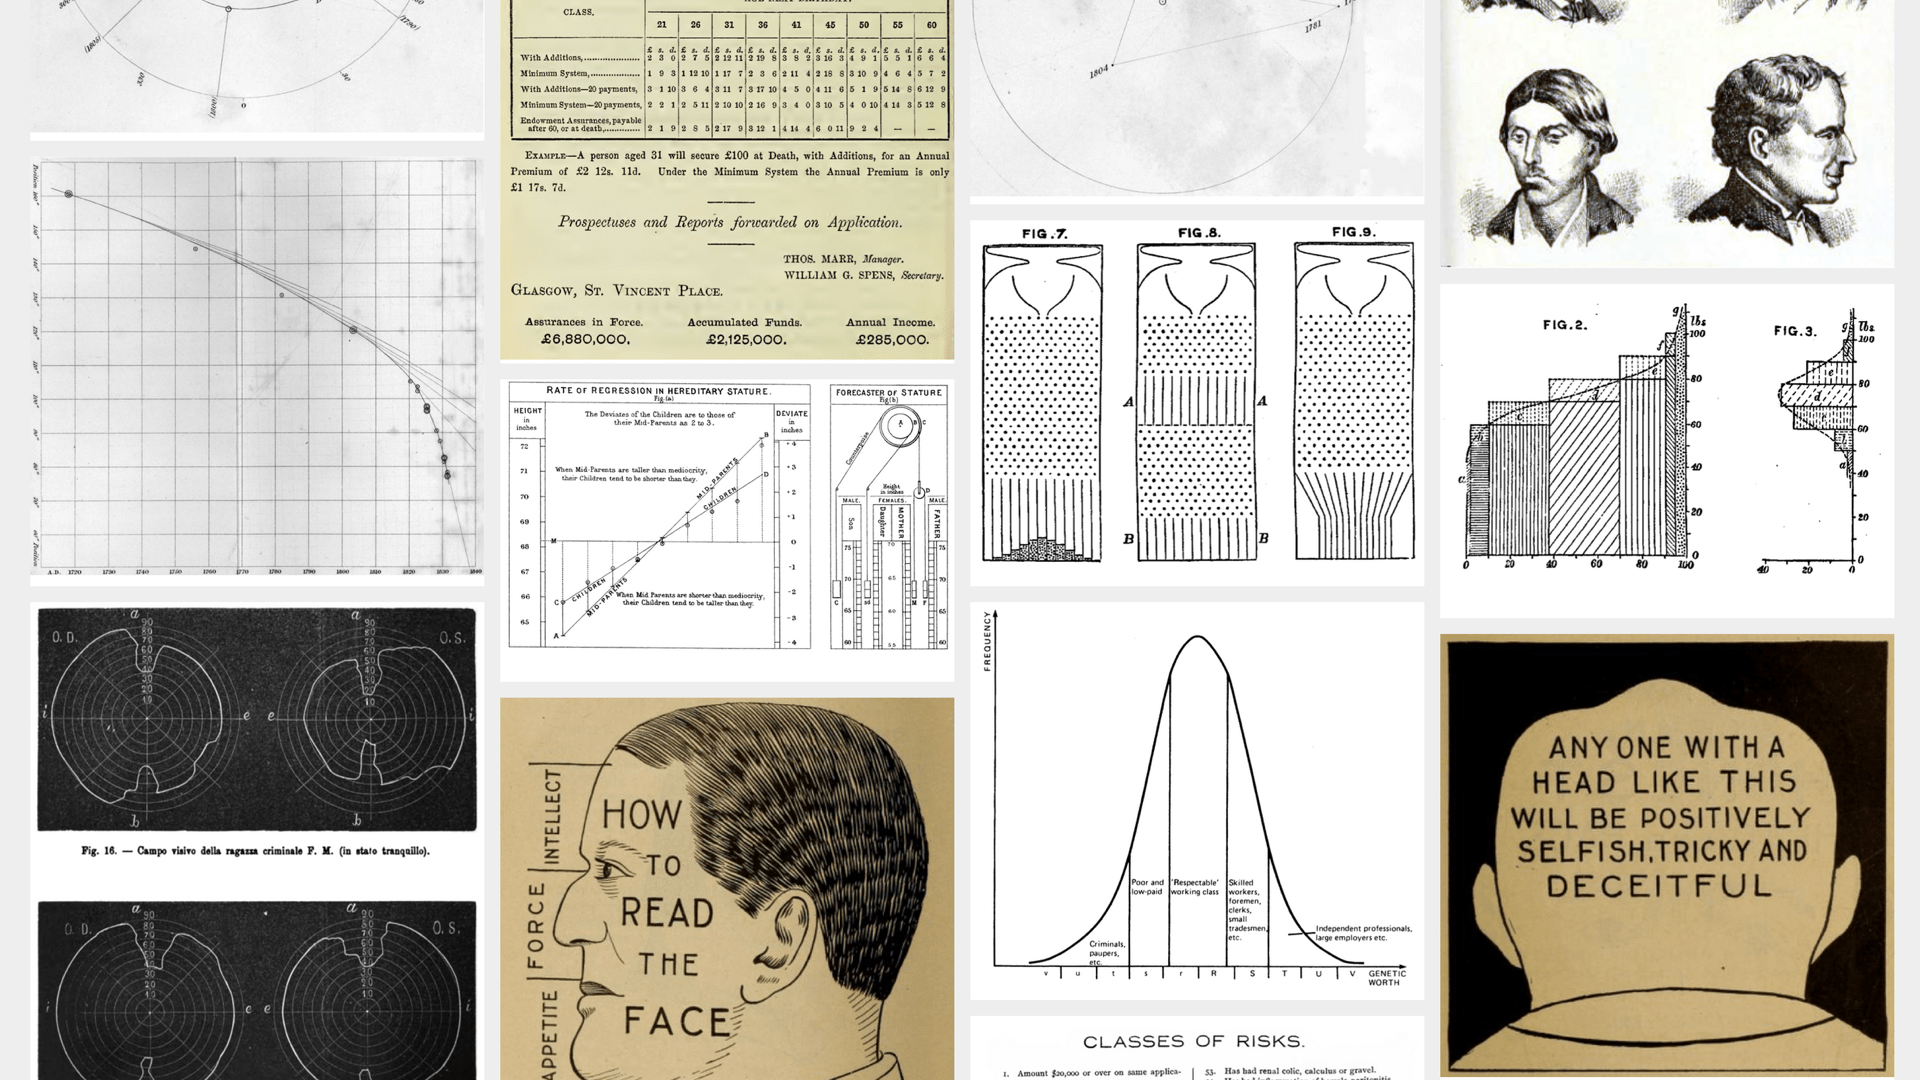
In 1936 there was indeed “a special interest in how to best discriminate” between populations mathematically. Classifying people and species was, and still is, a hot topic which I’ll come back to. Other research going on at the time included for example craniometry, with Mr E. S. Martin who was trying to differentiate between sexes using jaw measurements.3
Fisher found a way to separate the species mathematically: functions which split the 4-dimensional space of iris coordinates. The potential for prediction here is obvious, if you can separate species by their measurements and you measure a new specimen, you can tell which species it is likely to belong to. This idea is still very much a the heart of prediction today, which brings us to:
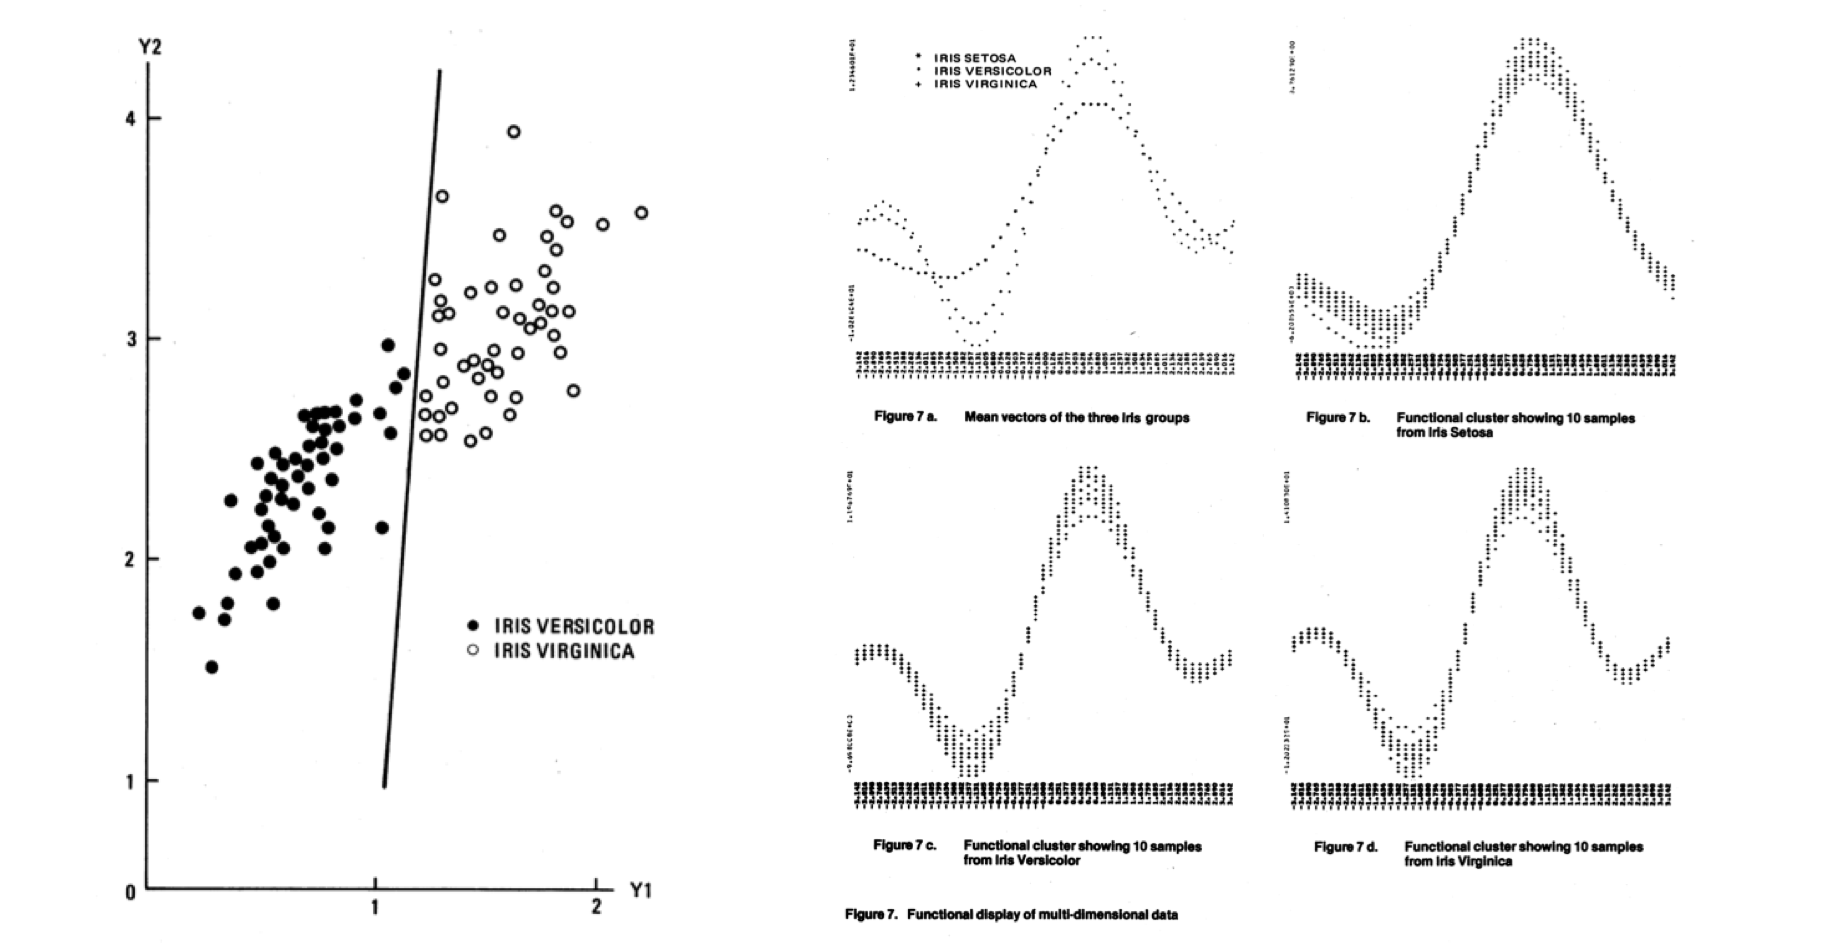
In the decades following Fisher’s paper, the basic idea of classifying a population based on data remained more or less the same. The methods got a lot more sophisticated, thanks in part to the development of computing, and started to be called different names such as “pattern recognition.” Throughout this history, Anderson’s iris data have been used as a test-case for new classification techniques, they became a demonstration tool. This is one example from 1976: 4
Today, the iris flowers are found in tutorials and demos for most machine learning software.
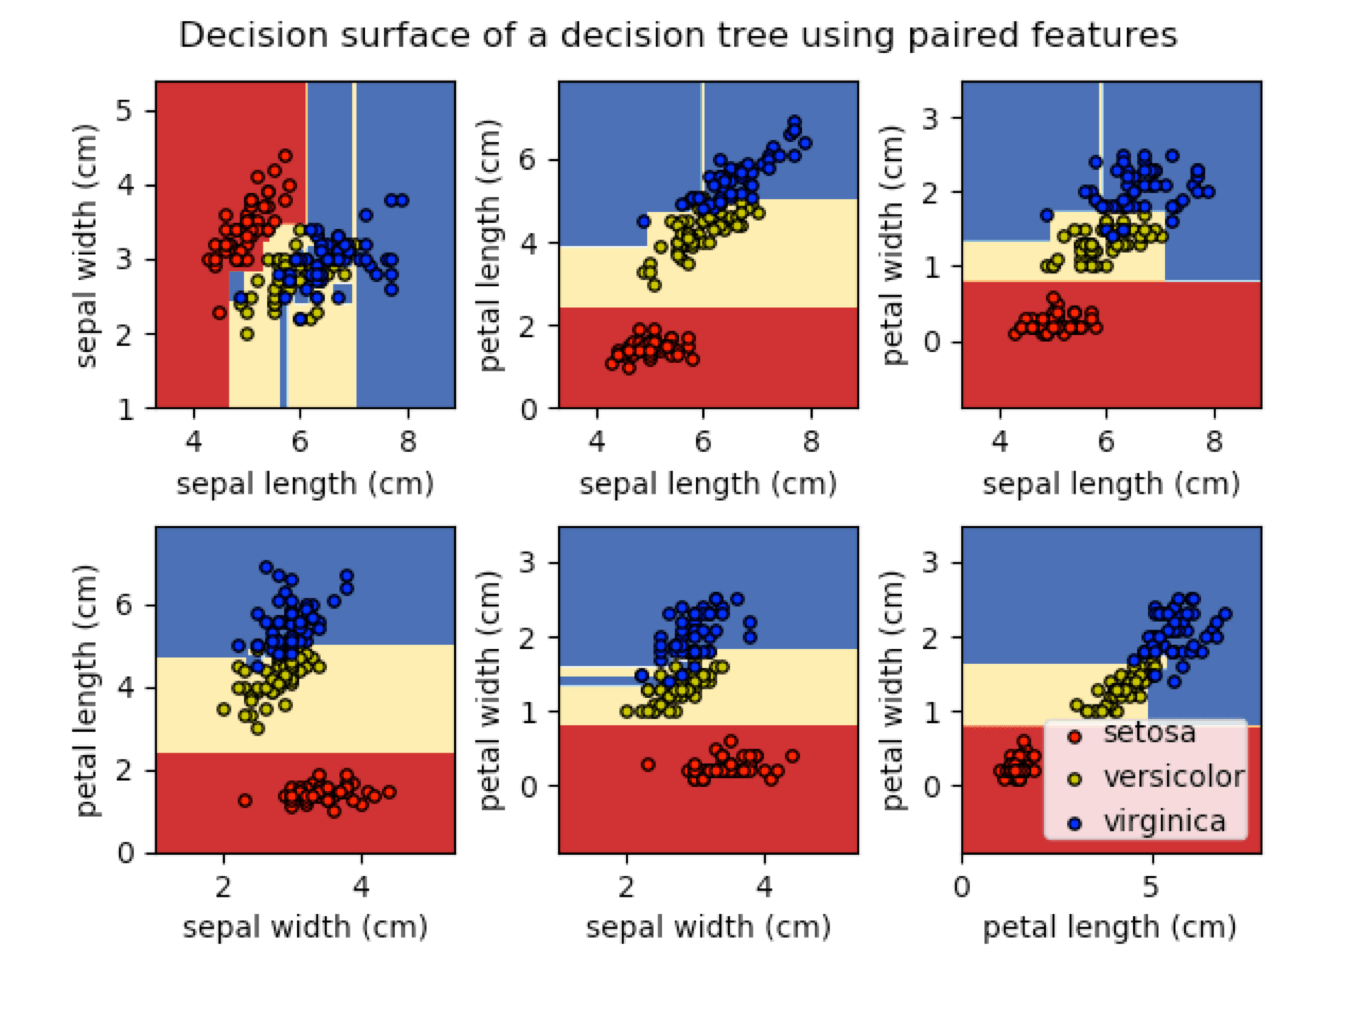
Decision Trees in the scikit-learn package.
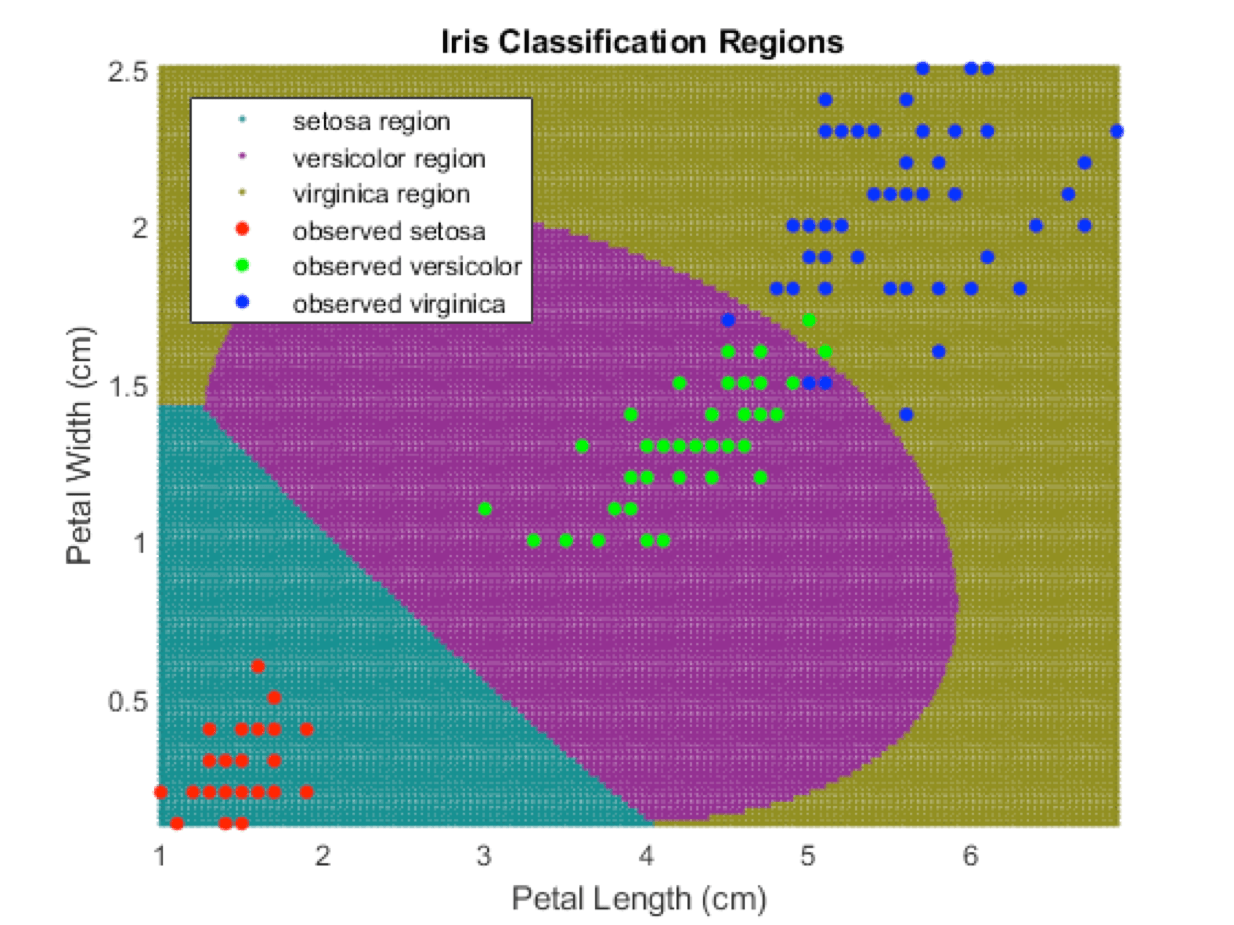
Support vector machines are a more sophisticated way of drawing the boundaries. They don’t have to be linear, i.e. they can be curves—and they can classify points with a lot more dimensions. They are shown here in a Mathworks demo.
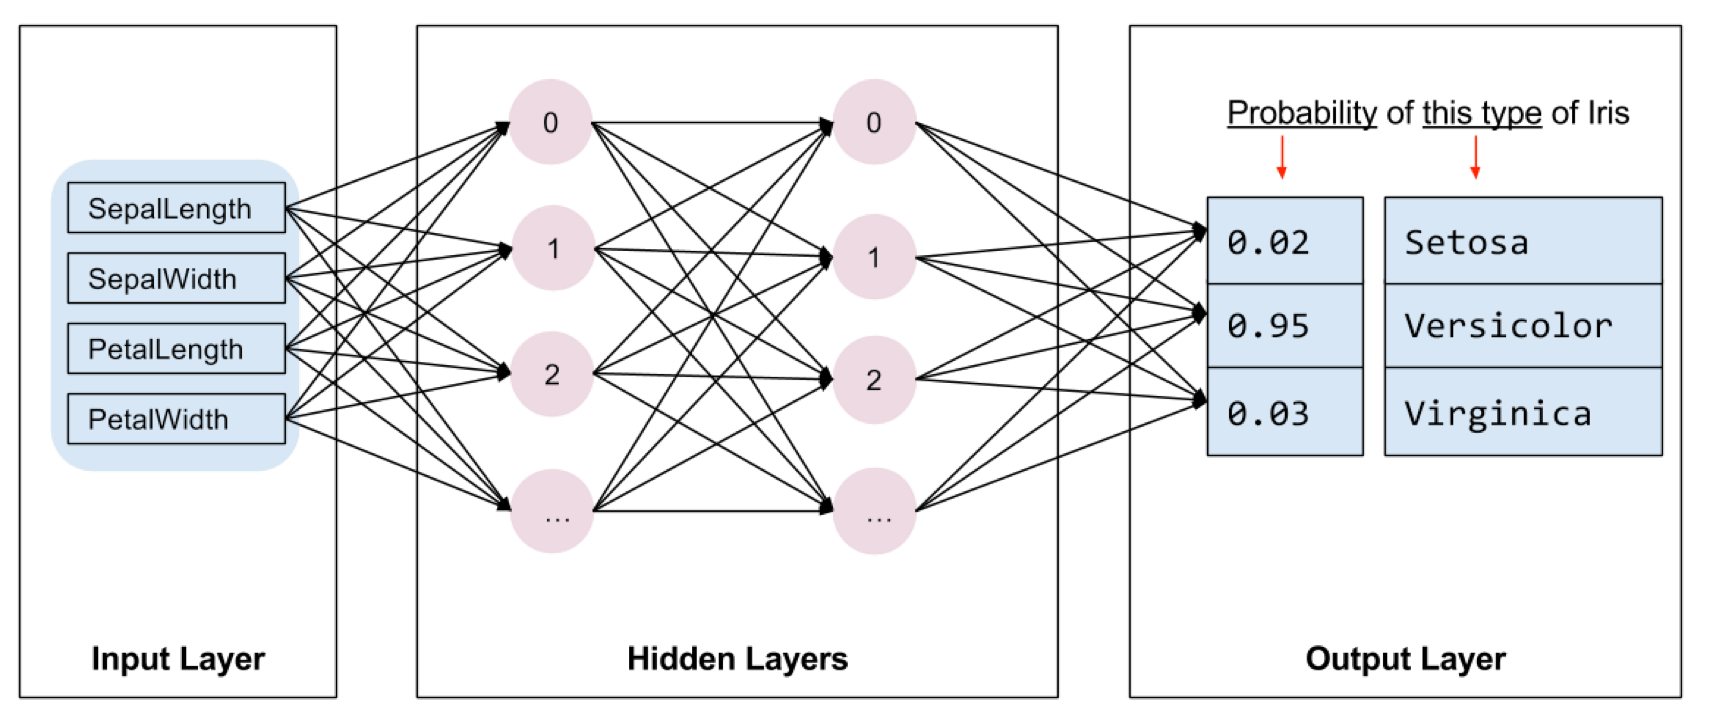
And of course neural-networks, which are currently all the rage. This is the ‘getting started’ tutorial from Google’s Tensorflow.
This history is interesting to me for a few reasons. First re-tracing these steps shows that what is currently being sold as ground-breaking ‘Artificial Intelligence’ is actually part of lineages that extend far back in time and bring pieces together from unexpected places such as botany. Some of these mathematical techniques are nearly a century old. They did get amplified by more computing power and exponentially more data, but the basic diagrams remain the same: drawing boundaries between categories.
Second, these lineages are not all pretty, and far from neutral. The original 1936 Fisher paper was published in the Annals of Eugenics. It is fairly easy to imagine how a movement concerned with the genetic optimisation of the human race would be interested in statistical ways to “best discriminate” between “classes”. When you download the paper, you get this warning:
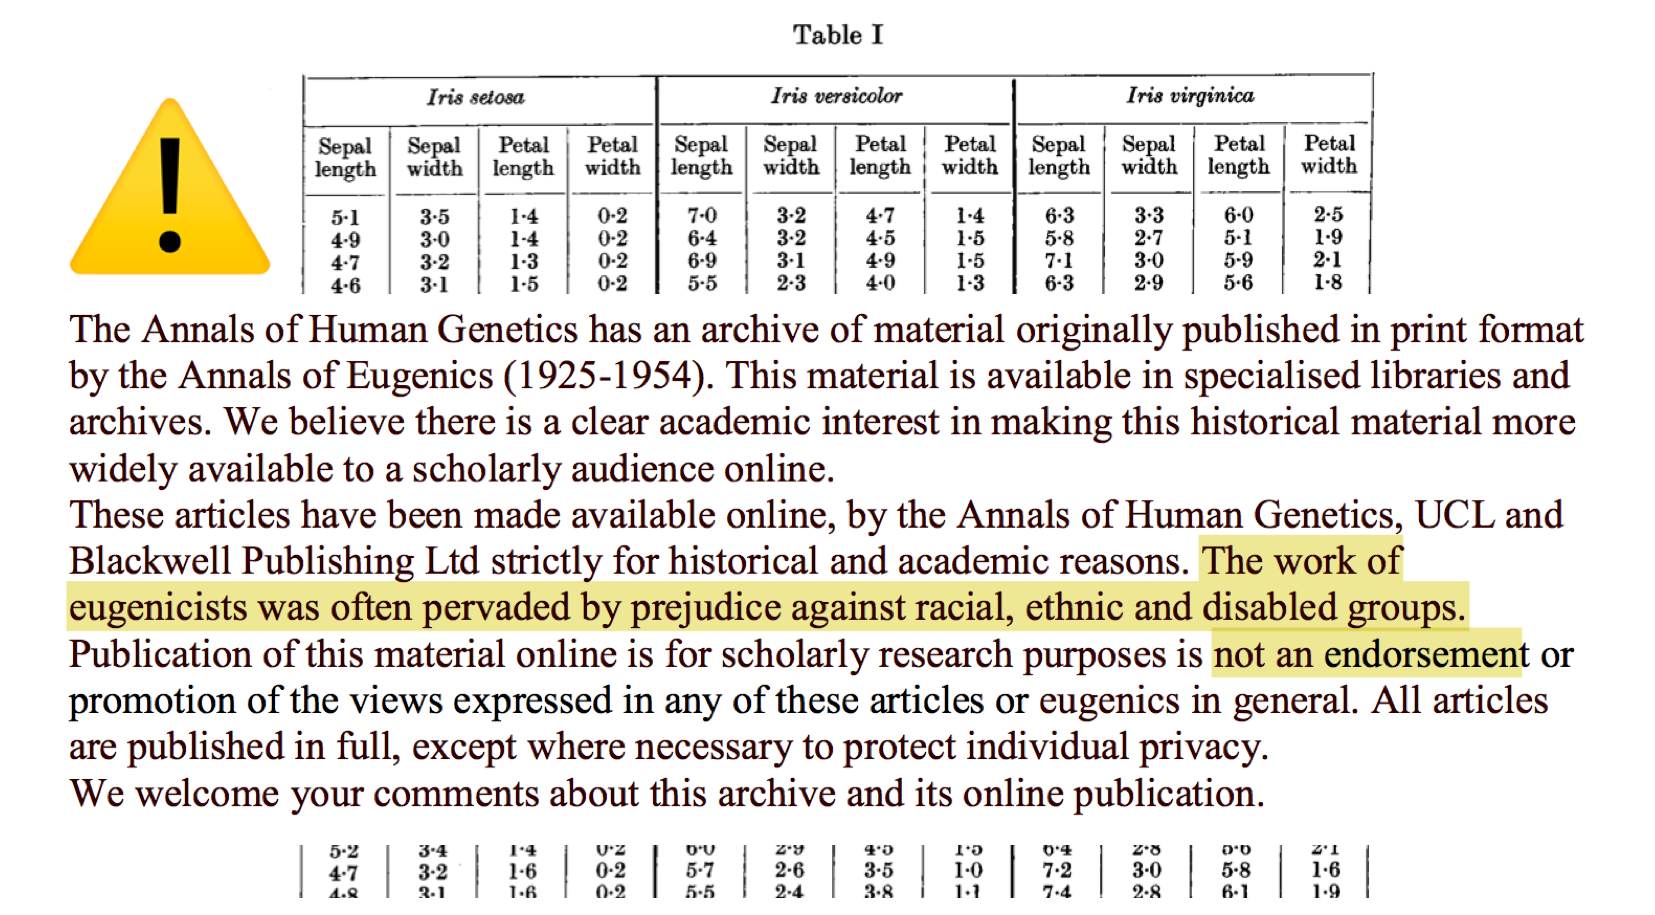
At the time of writing this talk, Google Scholar counts 14,206 papers citing this dataset. This does not include countless computer science classes, blog posts, tutorials, and so on. I would be willing to bet that very few of these carry the warning.
Of course it is too easy and simplistic to draw a direct line between eugenics and whoever is using the iris data today. But at the very least, in line with today’s theme, there is eugenics dust on these flowers. It is completely normalised, overlooked, and gets smuggled into our current systems in all sorts of ways.
Will the Real Iris Data Please Stand Up?5
My third reason to find the iris dataset interesting is that they are yet another example that data are neither objective nor static. In 1999 a group of researchers noticed that there were, in fact, a few versions of the iris dataset in circulation, with slightly different numbers. What was supposed to be a stable benchmark had over time, over being copied through the decades, slightly mutated into different species of itself.
These benchmark datasets are actually interesting in their own right. They are an idealised space where everything goes right. The data perfectly fits the prediction problem, and the other way around, which never happens out in the world. Yet they set the conditions of what questions can be asked.
This is another popular example, the MNIST database of handwritten digits, which contains 70,000 images.
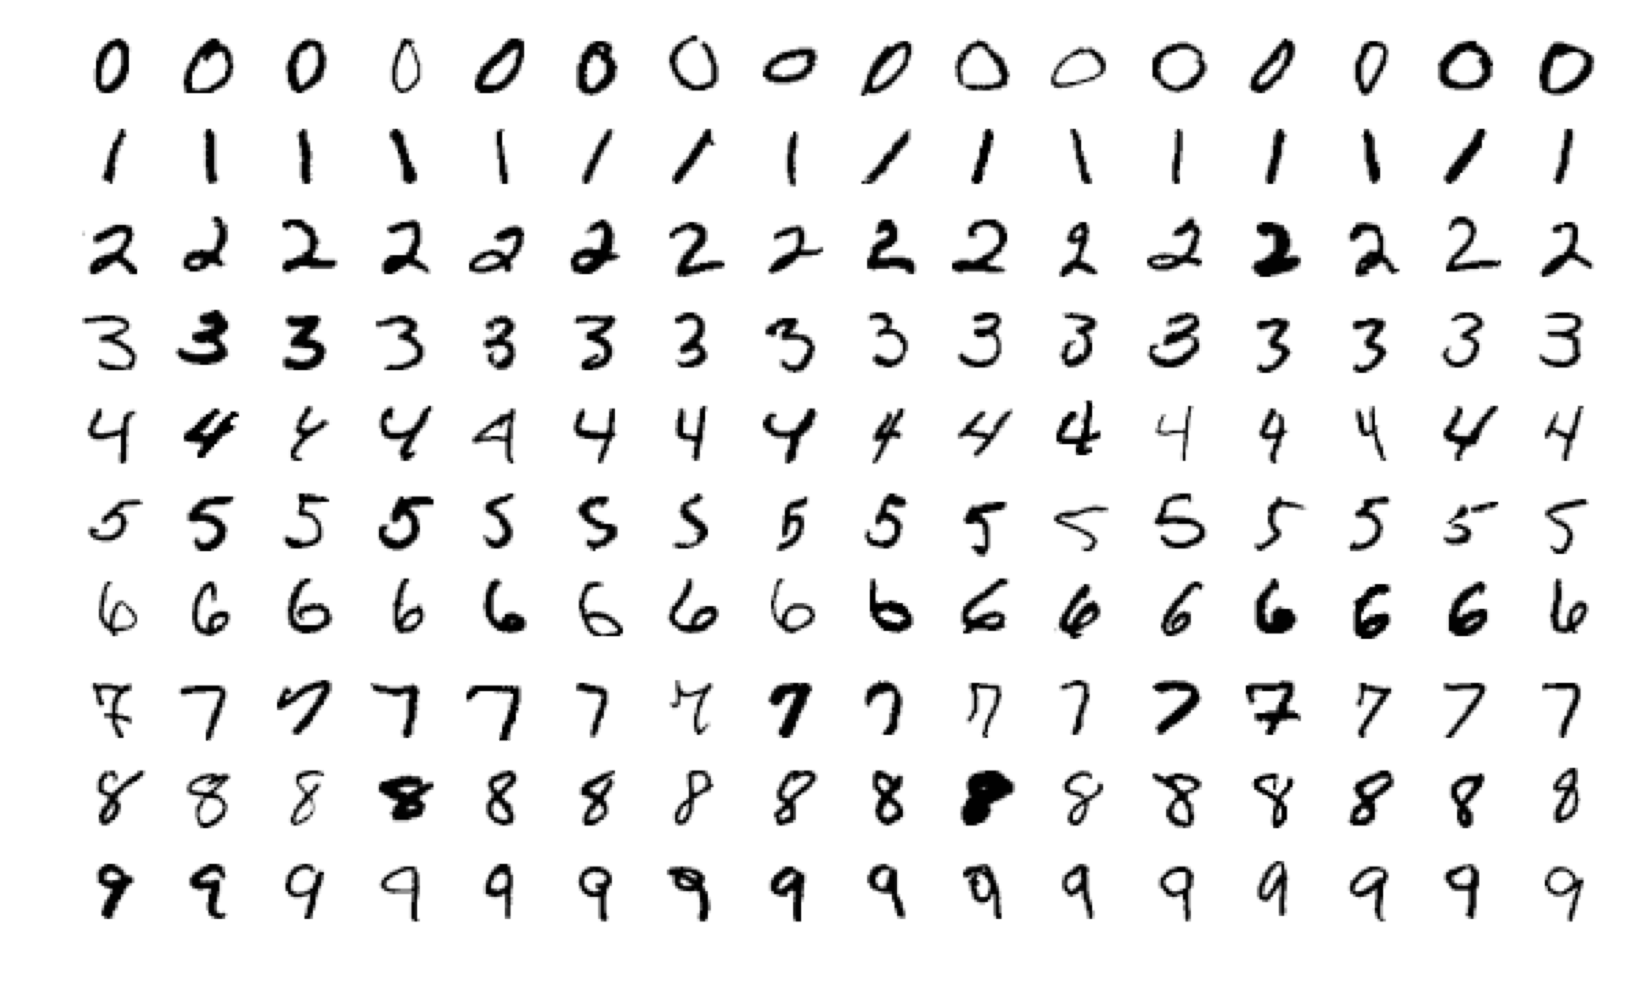
This is possibly the equivalent of Iris, which has only 150 data points, but for research in neural networks. Again, the basic idea is similar: you ‘train’ a model to recognise (classify) images of numbers, then you can predict new numbers from that model. In terms of vector space, these are 28x28 pixel images and the value of each pixel is a dimension, just like the width of the petal was one of 4 dimensions in iris. So MNIST has 784 dimensions, things are getting serious.
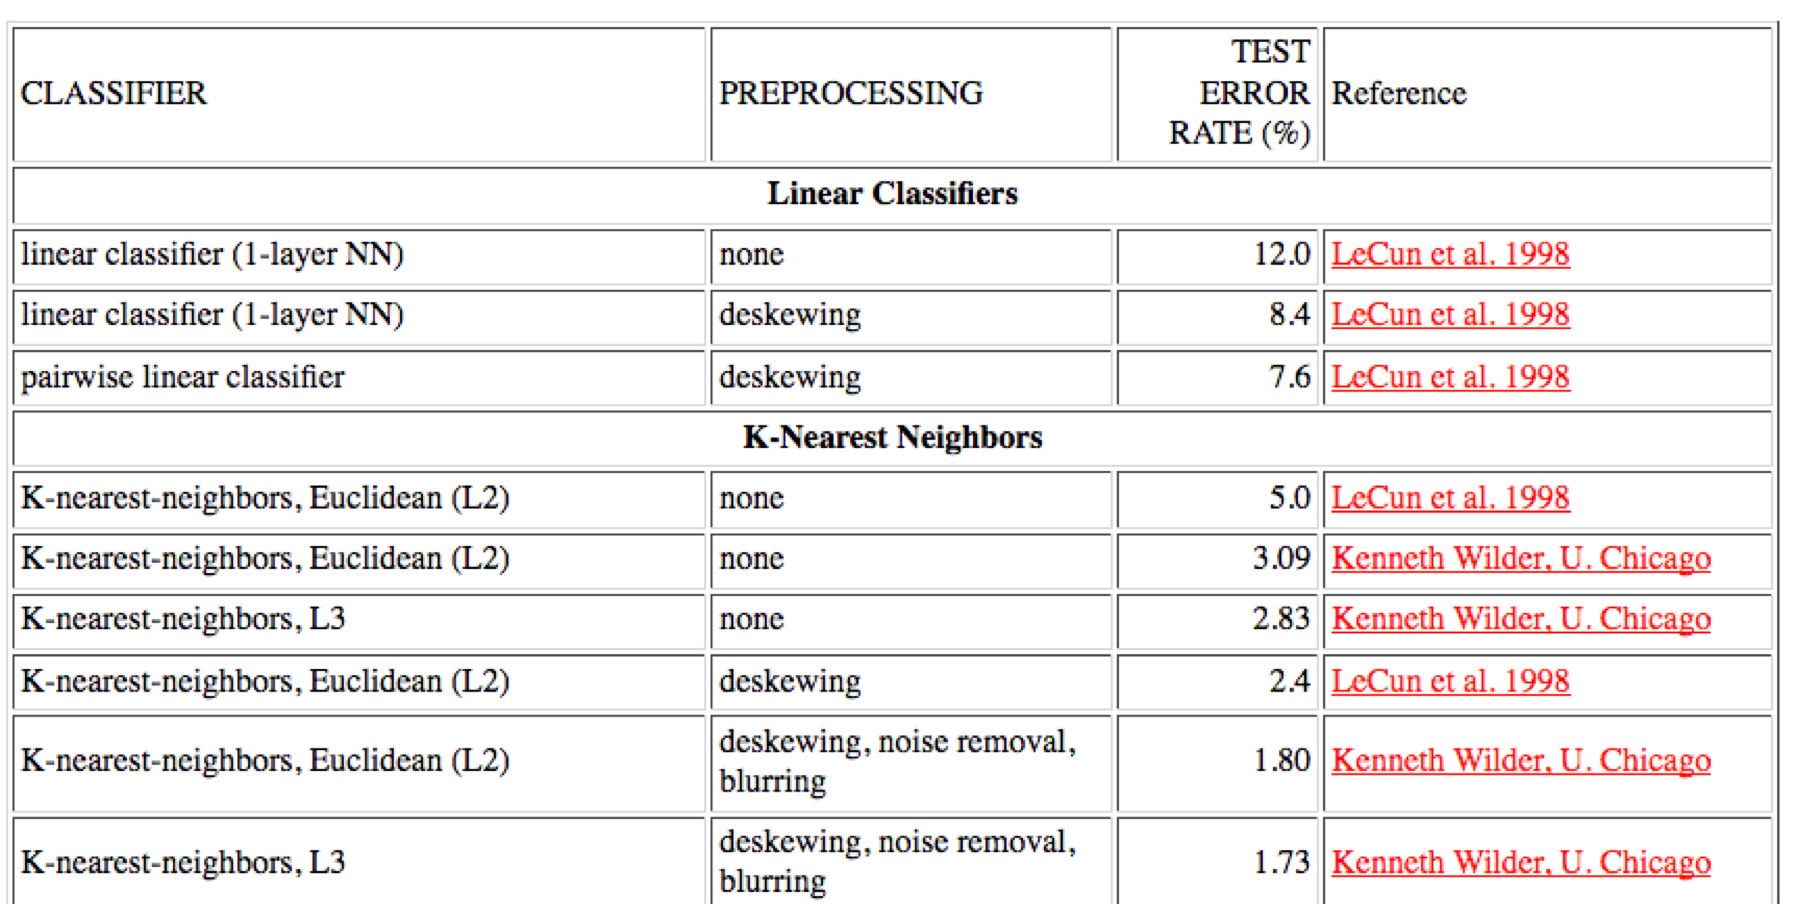
The goal here is to try to minimise the error of your predictions. This results in a score which is itself a subject for ranking and classification, as seen in the “high scores” table below. The vector spaces of test datasets like MNIST are also a kind of battleground for prediction performance. As Adrian Mackenzie puts it: 6
The field of digits becomes a site of differentiation not only of digits—the machine learners attempt to correctly classify the digits—but of the authority of different machine learning techniques and approaches. They become ways of announcing and delimiting the authority, the knowledge claims, or “truth” associated with the machine.
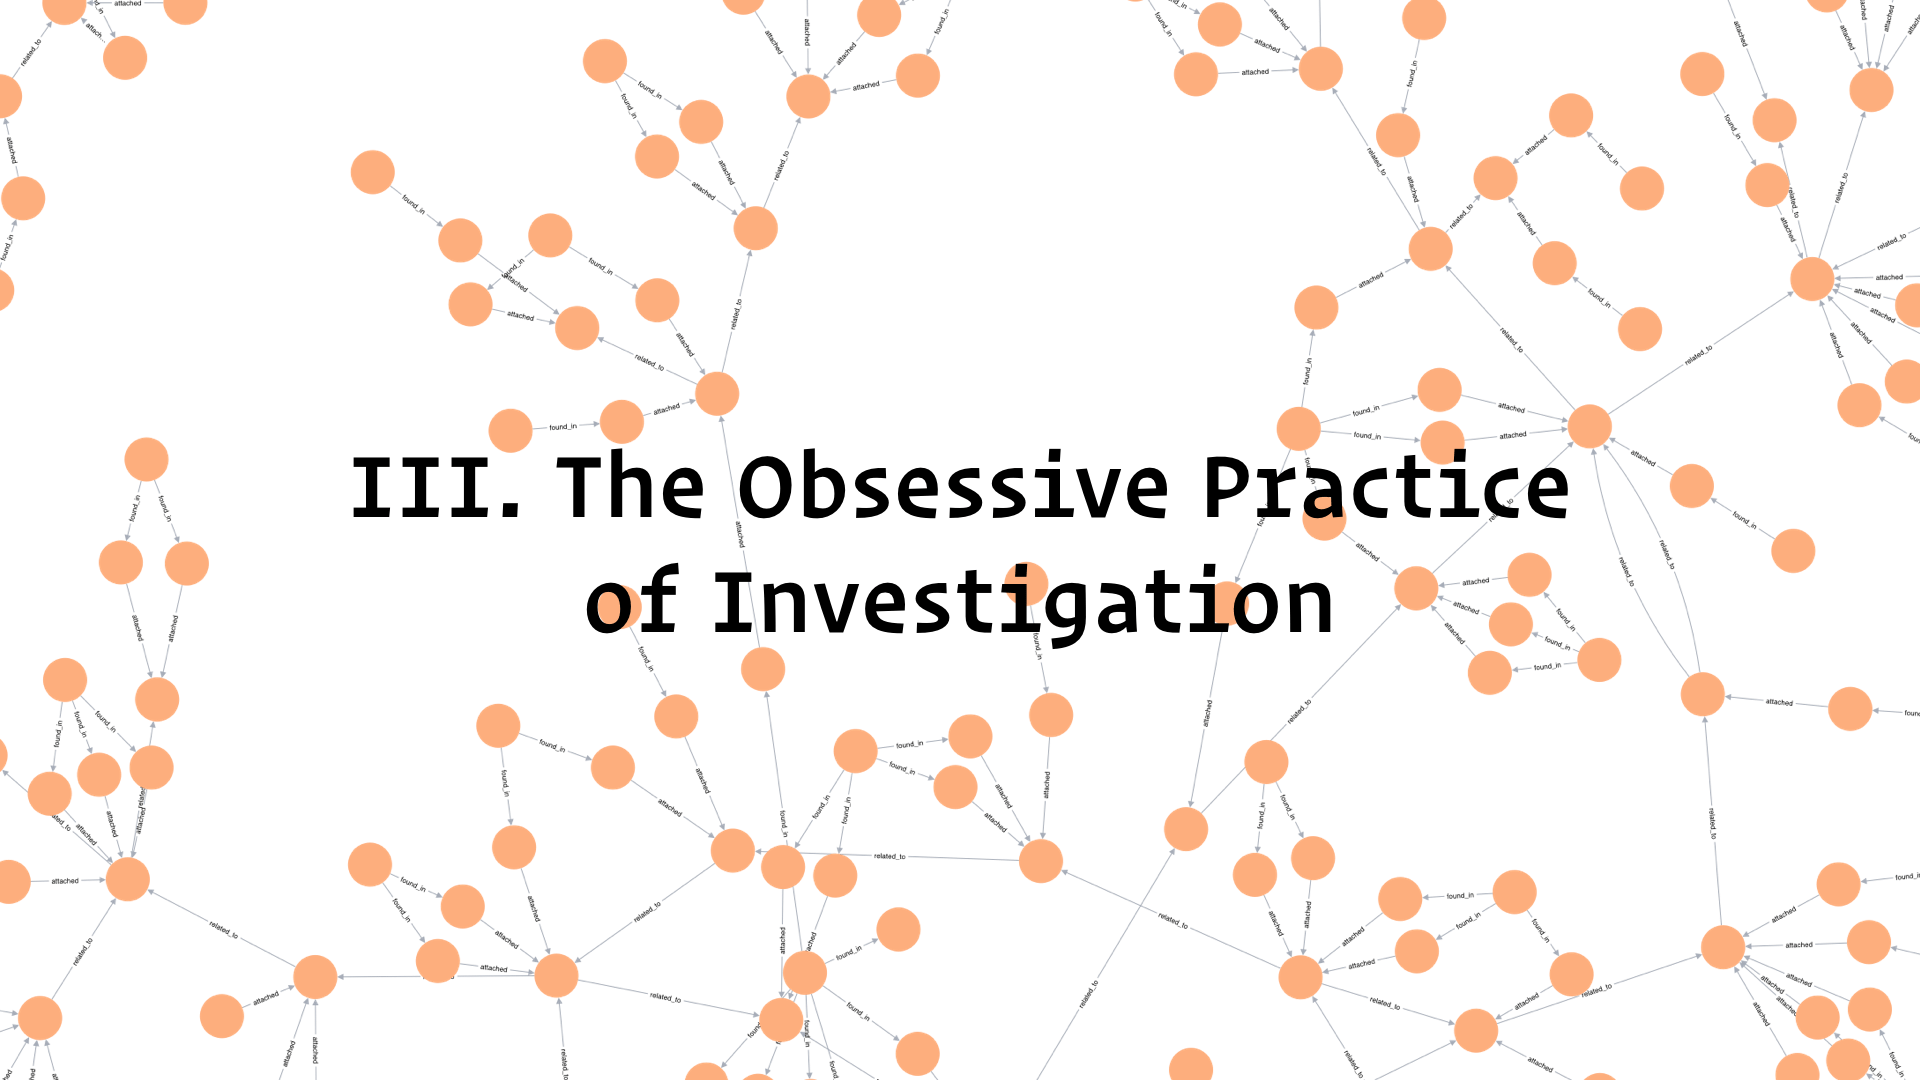
To conclude I am going to talk a little bit about how I am investigating these things. The iris dataset is just one example of a much bigger investigation which is definitely obsessive, and tests the limits of my sanity.
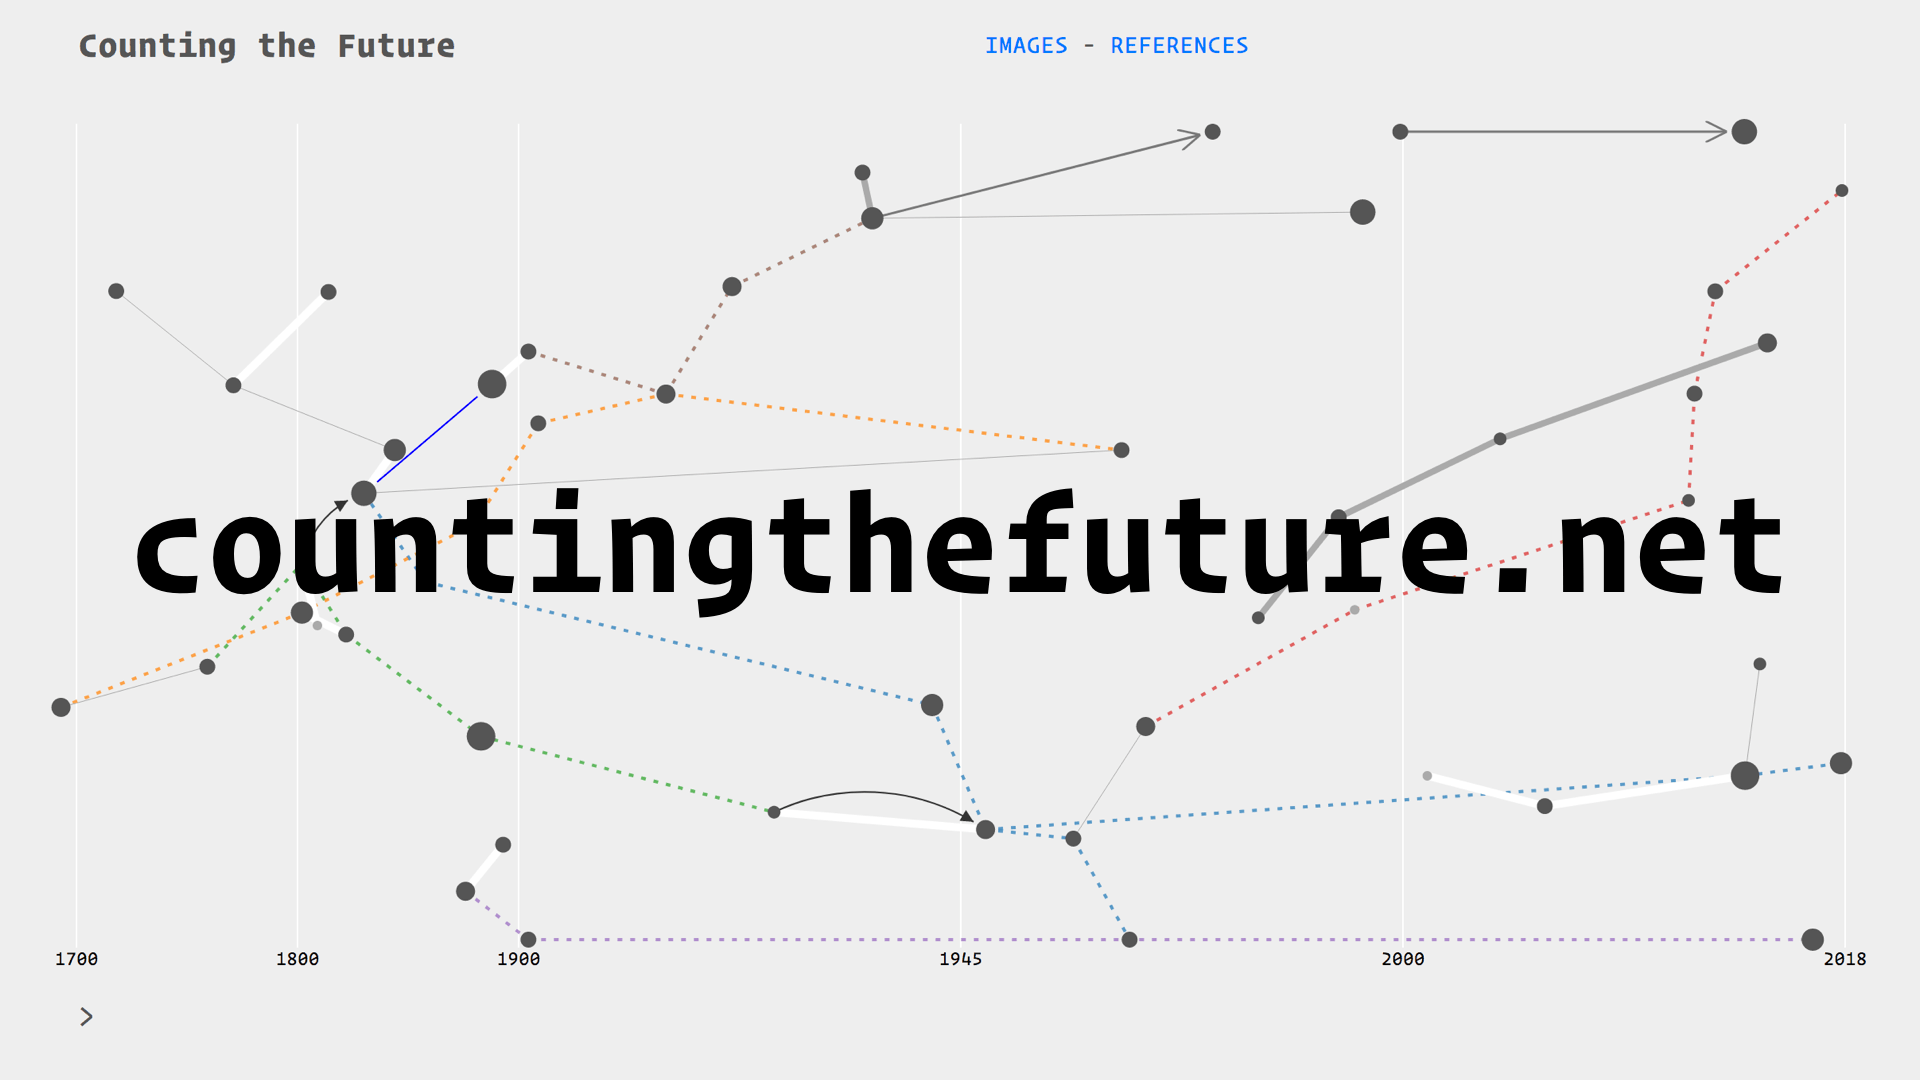
I am building a visual history of prediction called Counting the Future
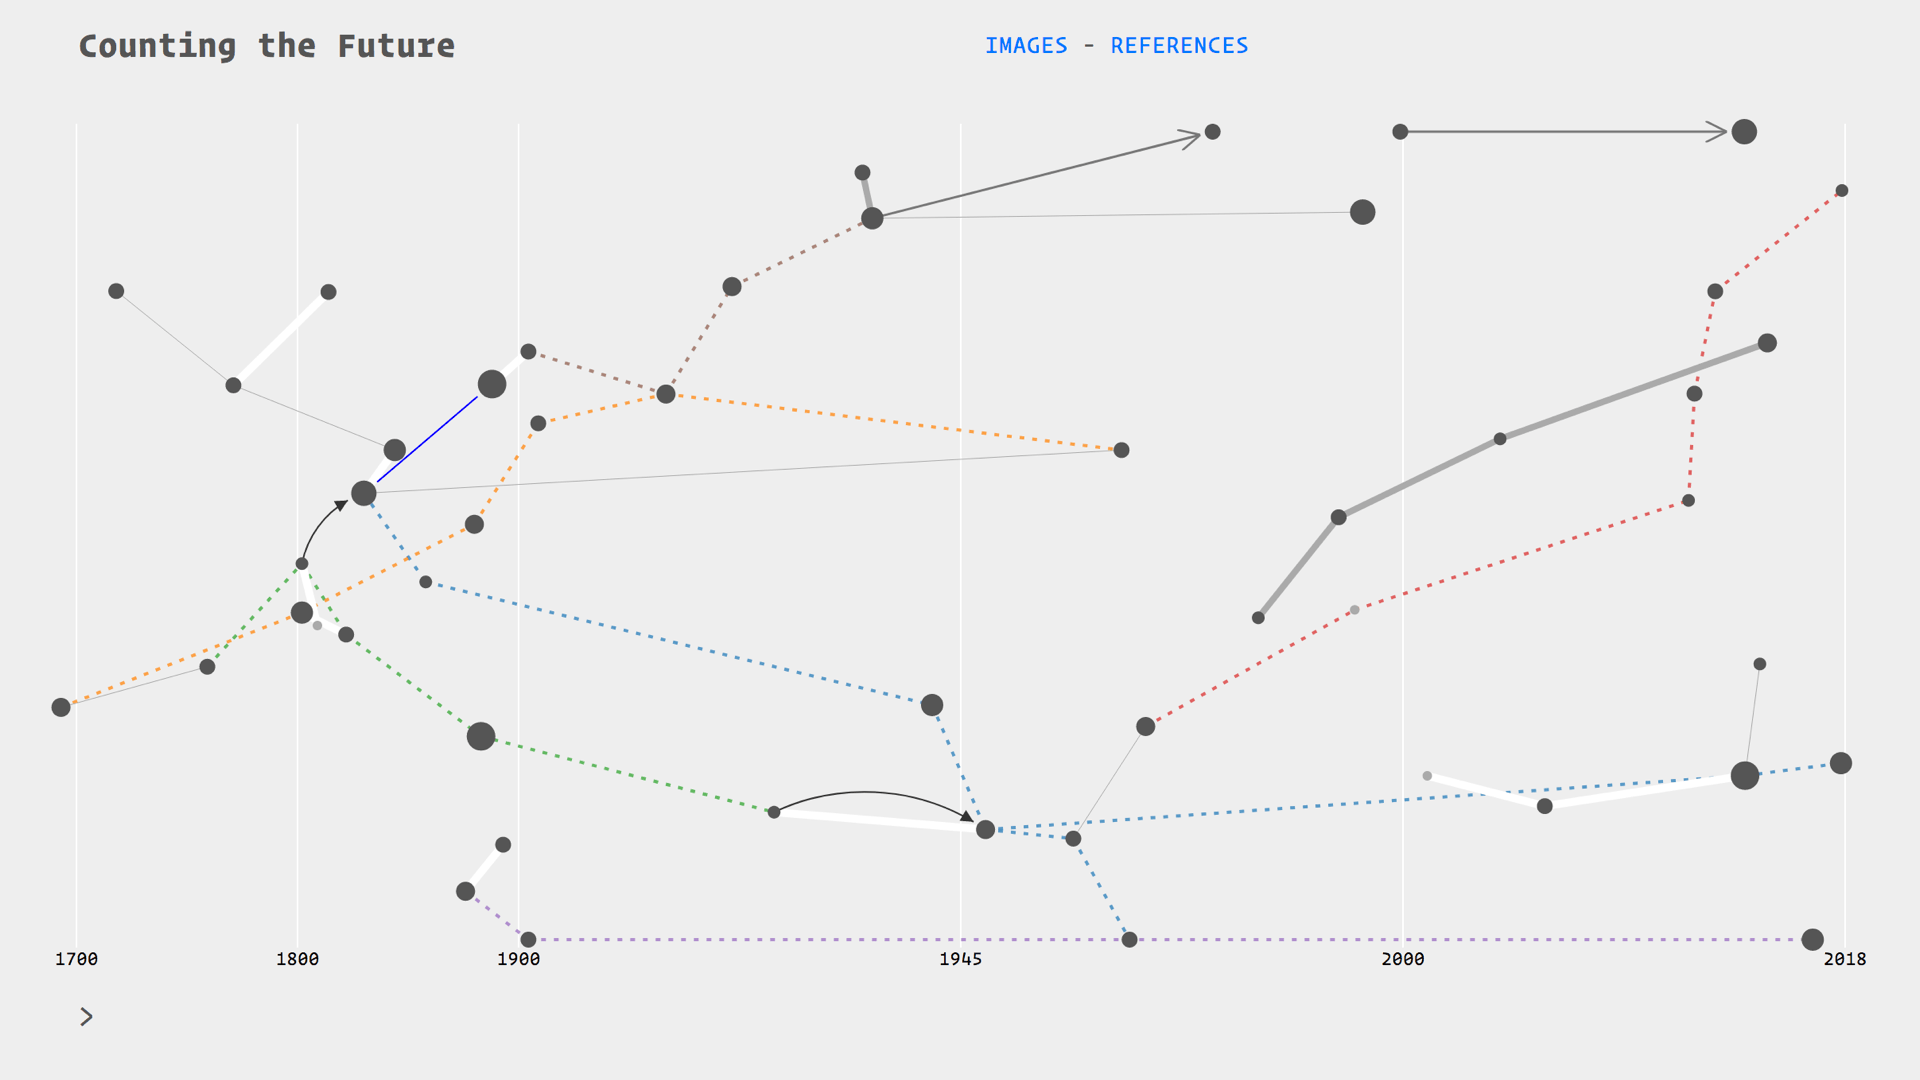
I am drawing from the literature on the history of statistics and probability, as well the growing field of critical data studies. My particular focus, as I have mentioned, is on extracting diagrams from this literature. I am putting all of these diagrams in relation with each other on a timeline.
These relations are thematic, for example there are threads on insurance, astronomy, finance, and social physics. They follow citation trails, the evolution of devices such as the Bloomberg terminal, or the transpositions of techniques between fields such as astronomy and finance. Essentially I am drawing a diagram of diagrams, and because it is over 300 hundred years
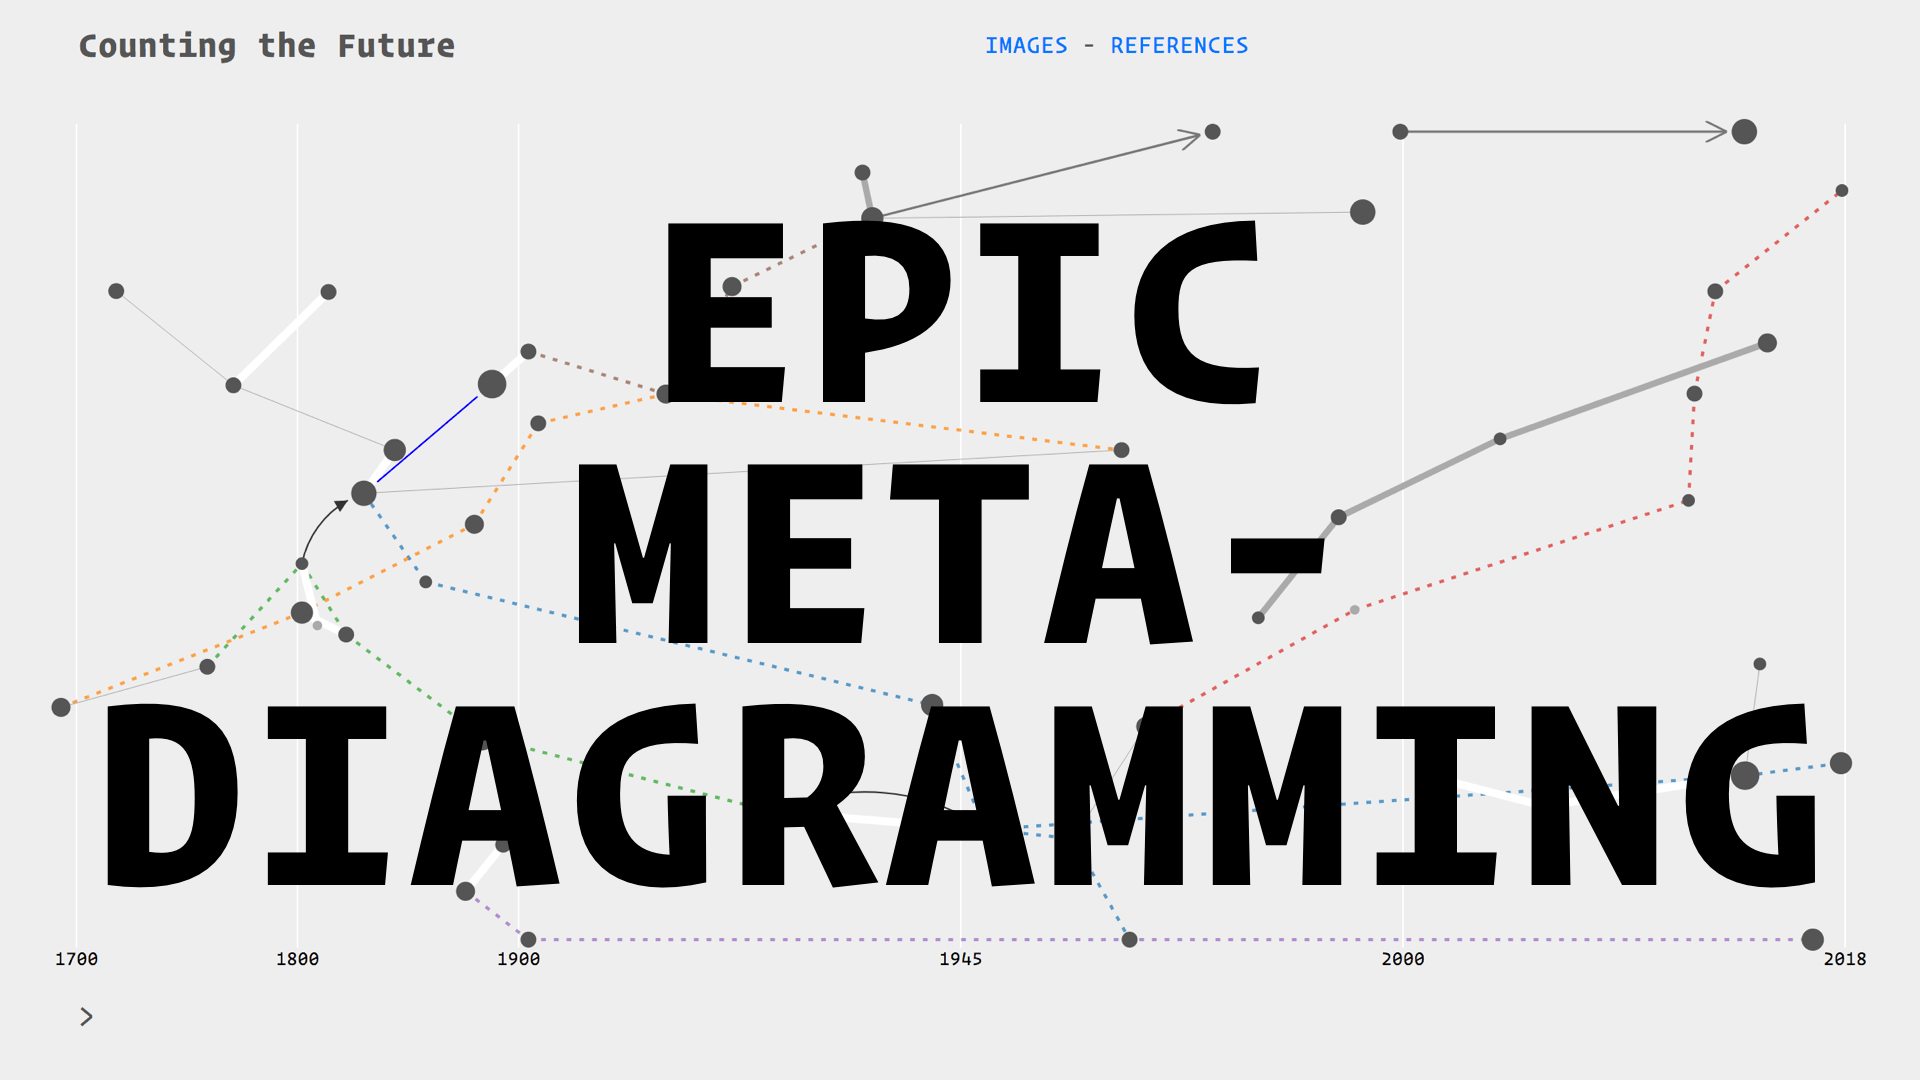
I am calling this practice:
Each of the nodes on this map is an artefact: a combination of diagrams and quotes for context. Here we have our Irises
There are different ways of viewing this information, for example by browsing through the diagrams as a kind of Tumblr blog layout.
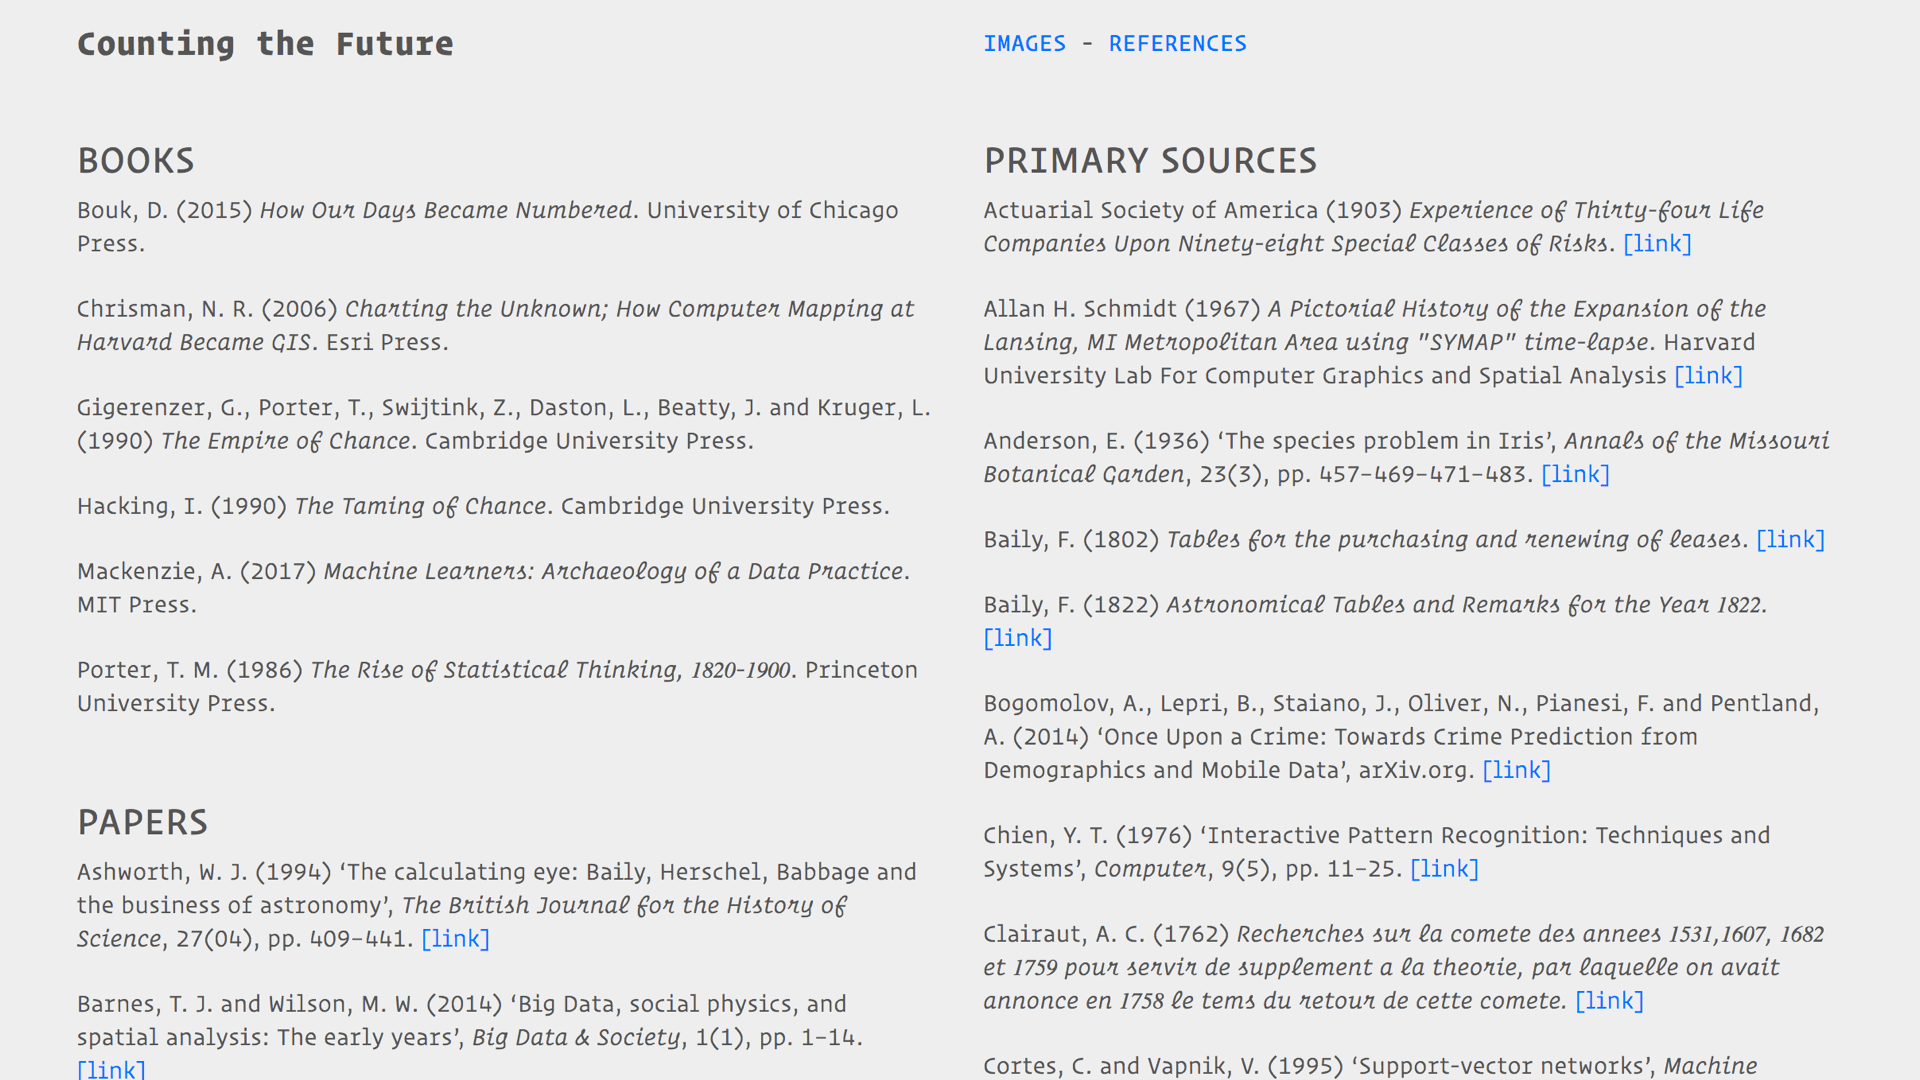
And of course you can follow some rabbit holes yourselves by going through the references.
You can view this work-in-progress at countingthefuture.net
Although I use data visualisation tools for this, I have no ambition to be exhaustive or even remotely objective. I am effectively adding a layer of interpretation to accounts from historians of science and other scholars.
This is only a representation of my own knowledge. The links, as I have said, are drawn according to themes or other factors which I am still figuring out. The size of nodes is relative to the amount of information I have attached to them.
I am entering and collecting all of this information “by hand.” Which makes it less like data, and more like what Johanna Drucker calls capta.7 The distinction is that capta are “actively taken” whereas data are considered given. This means this project is forever incomplete, subjective, and possibly wrong.
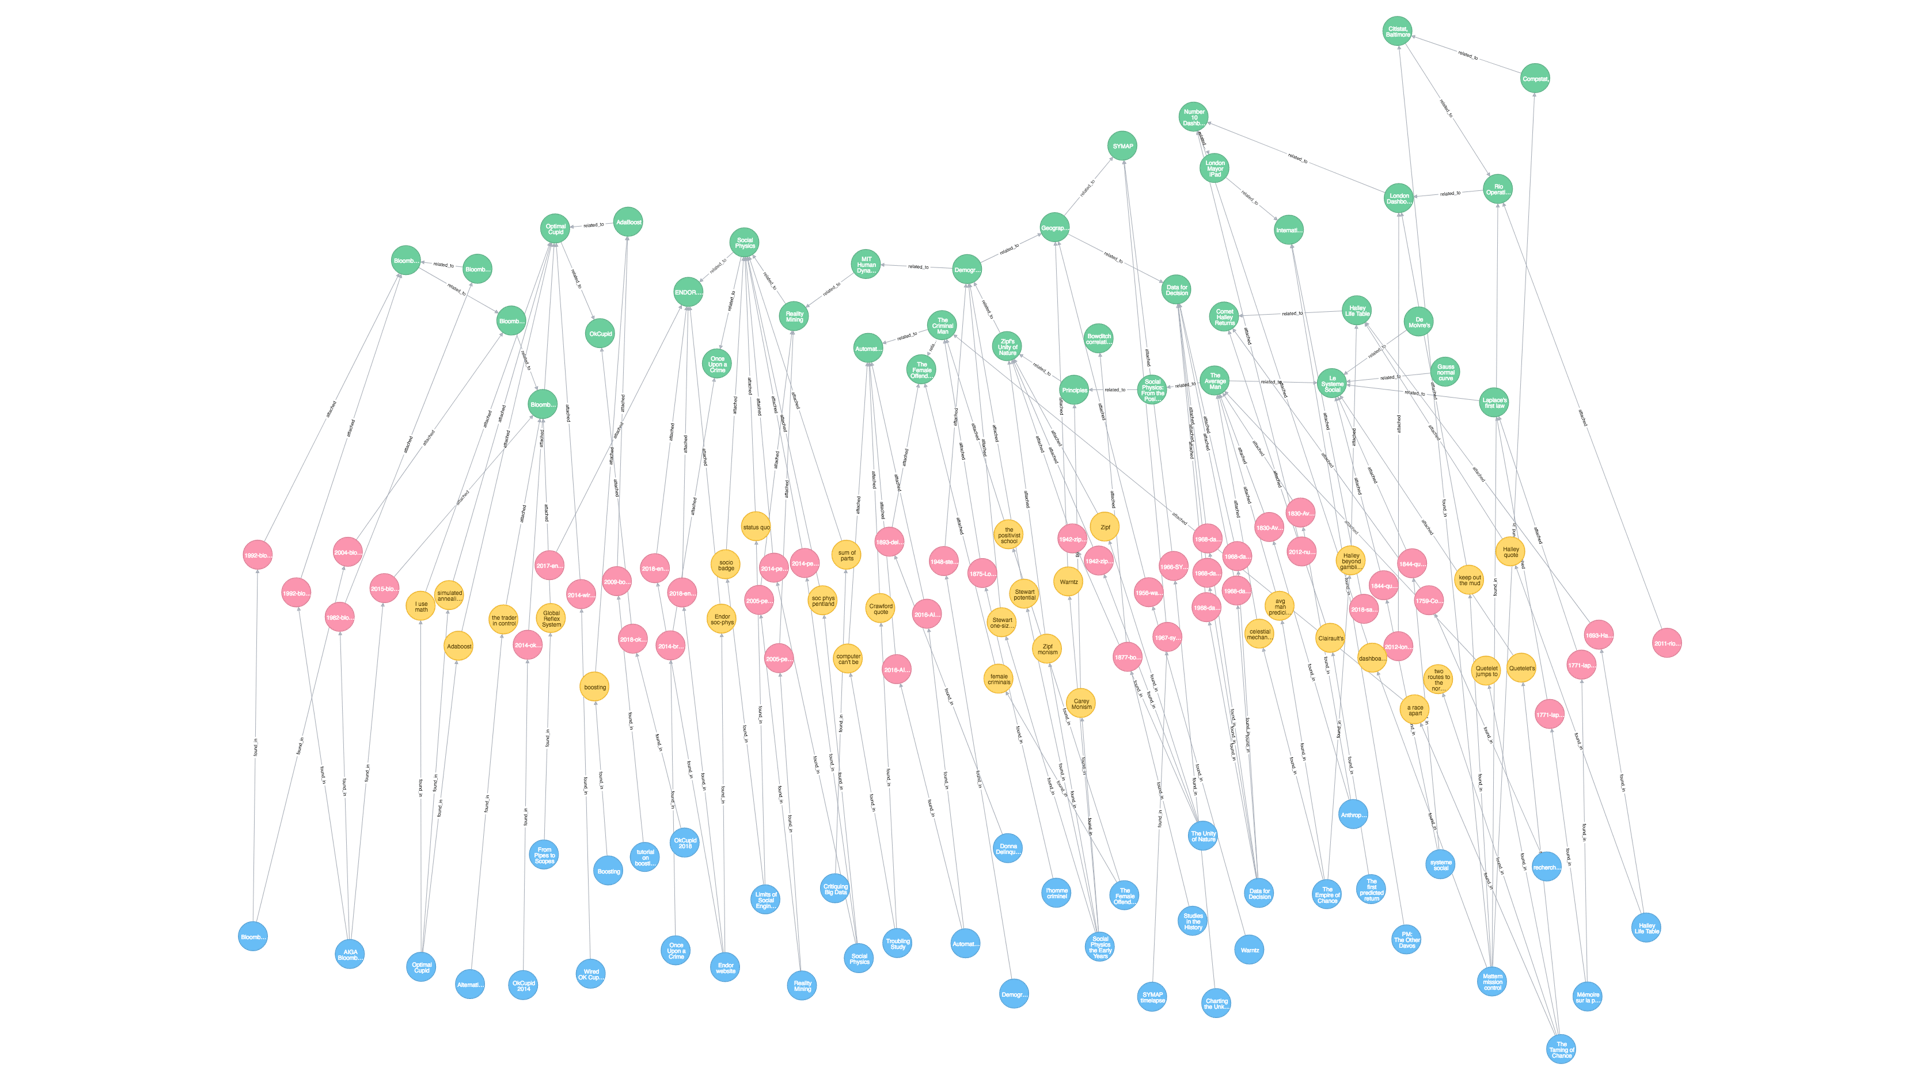
This is what the epic meta-diagram looks like at the moment. The data are literally stored as a diagram—a graph database. I have chosen this format because it is very flexible and reflects the connected, diagrammatic nature of the things I am trying to investigate. The visible part of the timeline is the green nodes at the top, the rest are the references, images and quotes which extend in a kind of rhizome.
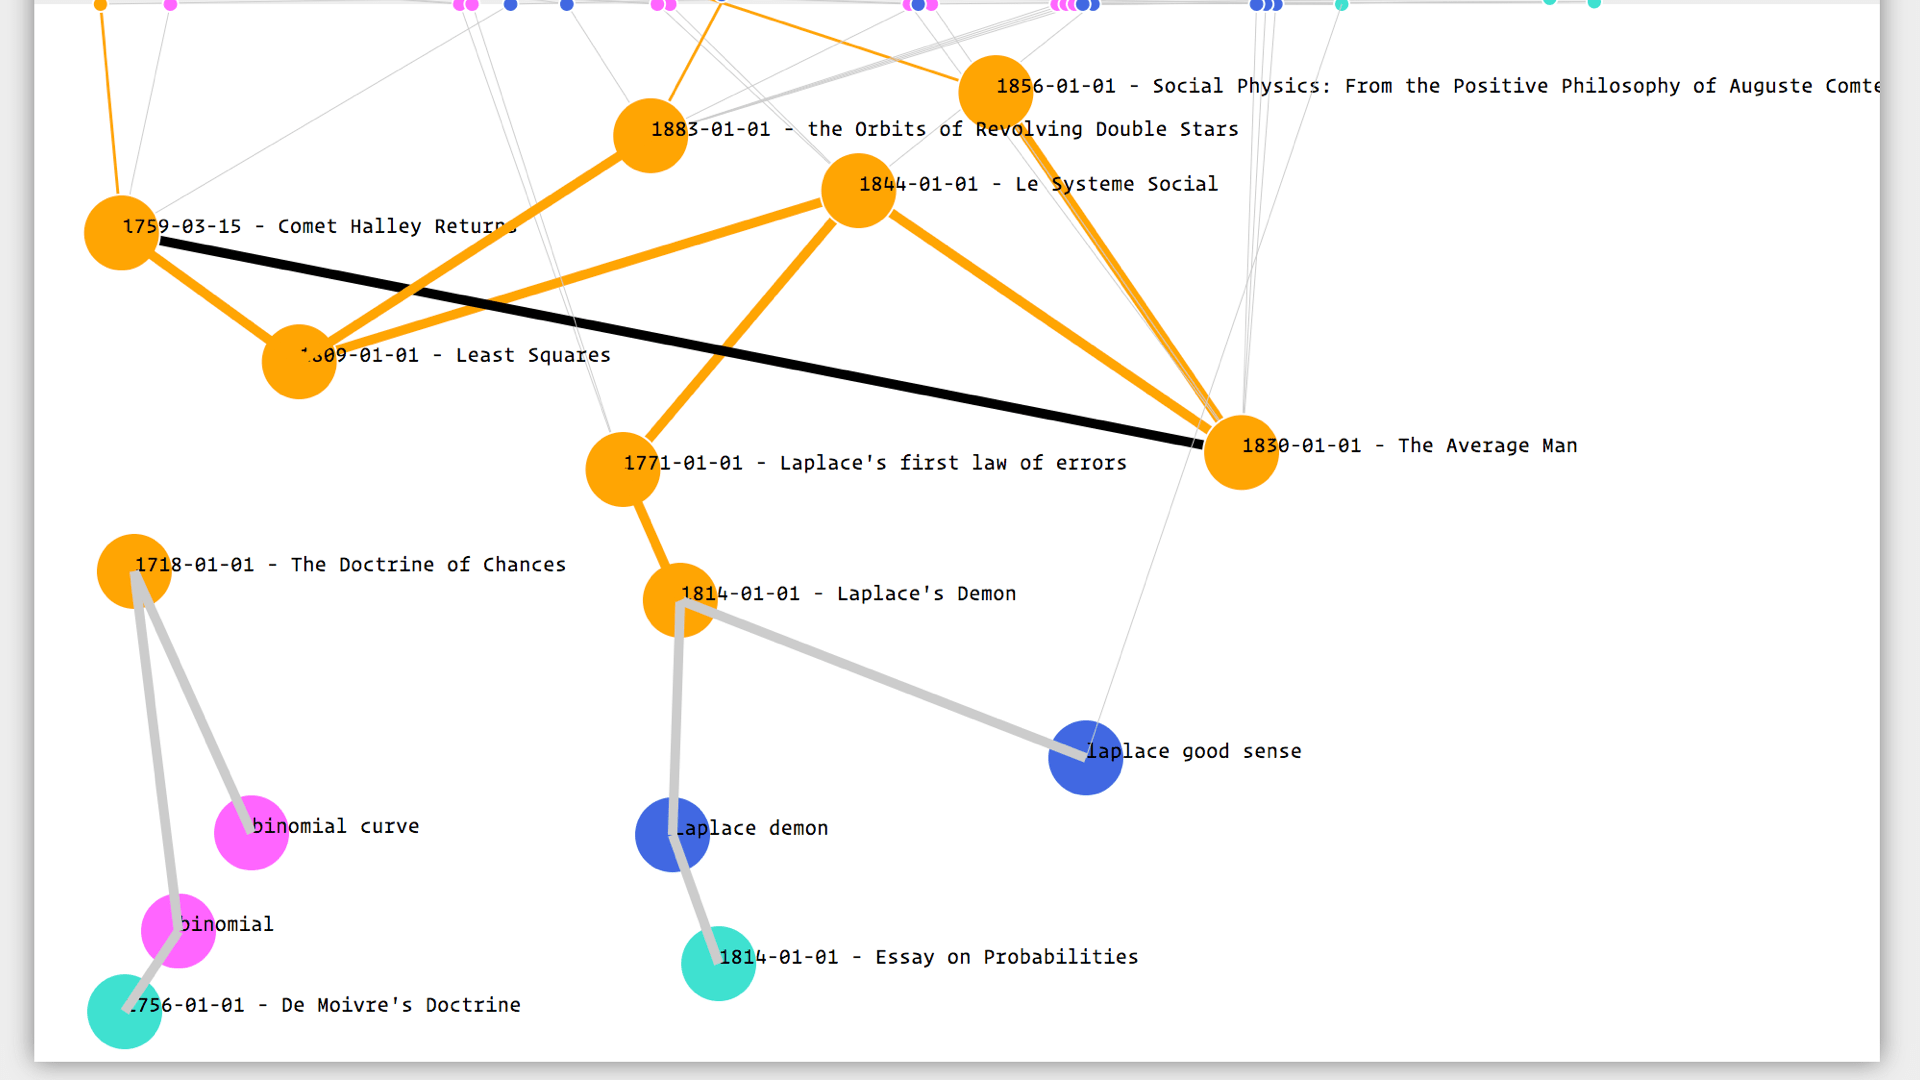
I have built myself an editor so the practice of plotting this map, is actually visual all the way through. Again this echoes Drucker and her “visual forms of knowledge production.”8
This is the digital workbench on which I do most of my obsessing. For example here I am trying to figure out who came up with the normal distribution:
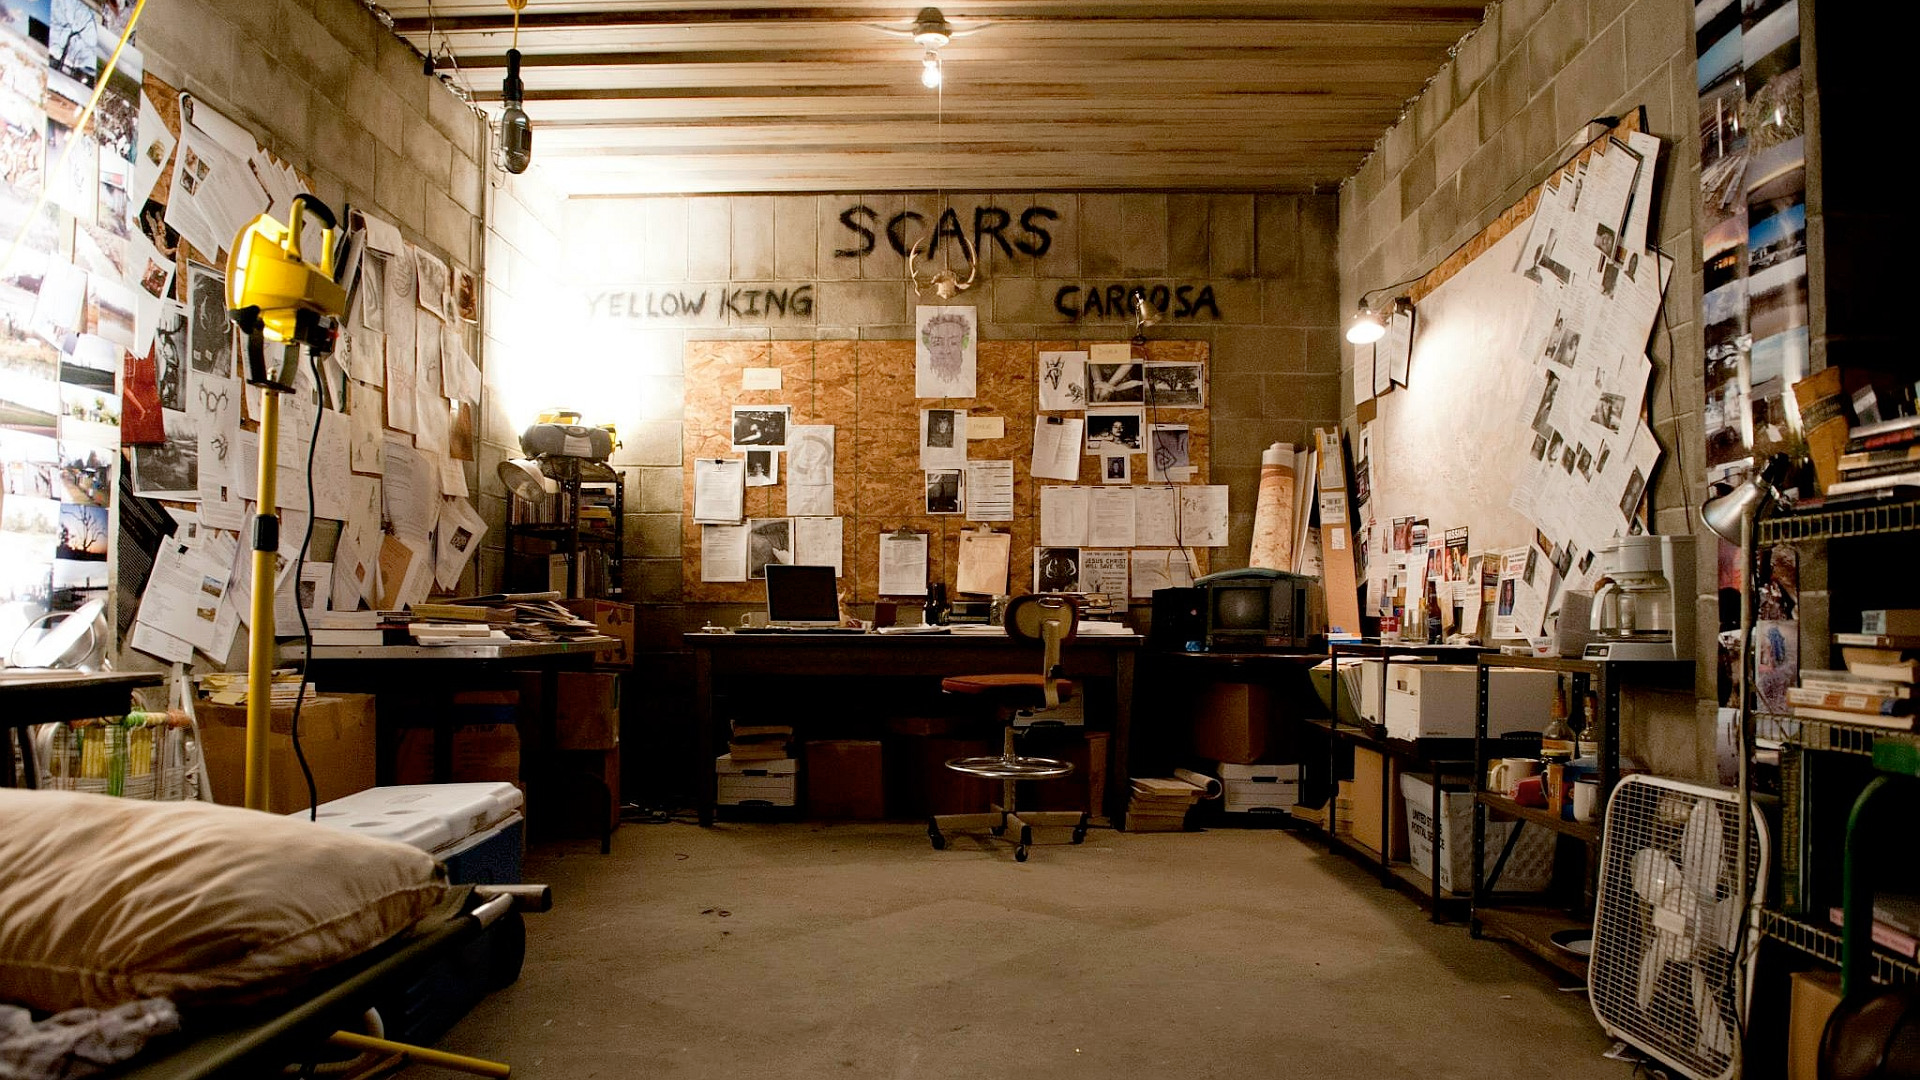
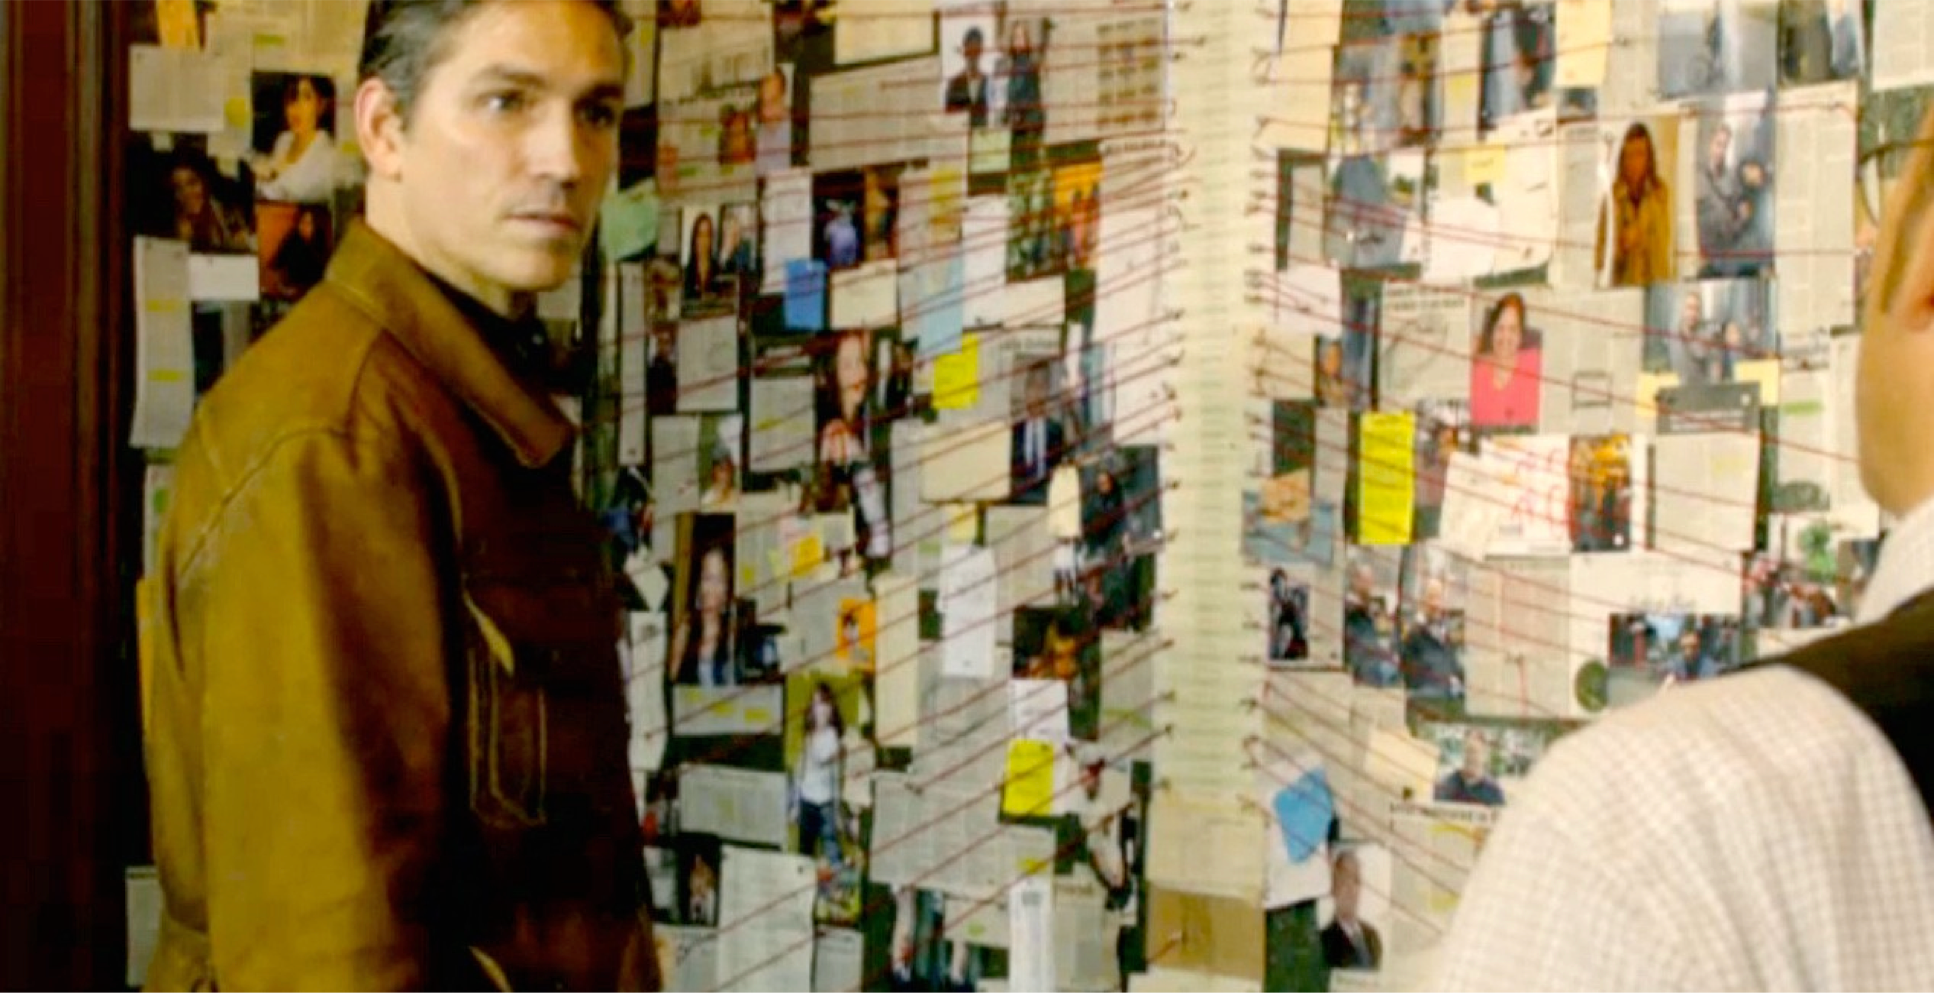 Crazy Wall in Person of interest. crazywalls.tumblr.com
The best analogy I have so far for this type of practice is the “crazy wall”—the plot device used in crime films and TV series. This is a board or wall on which the detectives chart their progress with pictures, pins, and string. The main difference is that I never expect to find whodunnit
Instead, I am quite happy to keep constructing this thing as an end in itself, and as a starting point for other projects.
As a kind of archive or publication, I also hope this can be useful to others—that it can provide a new way to access the rich and fascinating literature on the history of prediction, and invite multiple readings and re-readings of the lineages that converge in the current moment.
Anderson, E. (1936) ‘The species problem in Iris’, Annals of the Missouri Botanical Garden, vol. 23, no. 3, pp. 457--483 [Online]. DOI: 10.2307/2394164.↩
Fisher, R. A. (1936) ‘The Use of Multiple Measurements in Taxonomic Problems’, Annals of Eugenics, vol. 7, no. 2, pp. 179--188 [Online]. DOI: 10.1111/j.1469-1809.1936.tb02137.x.↩
cited in Fisher (1936)↩
Chien, Y. T. (1976) ‘Interactive Pattern Recognition: Techniques and Systems’, Computer, vol. 9, no. 5, pp. 11--25.↩
Bezdek, J. C., Keller, J. M., Krishnapuram, R., Kuncheva, L. I. and Pal, N. R. (1999) ‘Will the real iris data please stand up?’, IEEE Transactions On Fuzzy Systems, vol. 7, no. 3 [Online]. Available at https://pdfs.semanticscholar.org/1c27/e59992d483892274fd27ba1d8e19bbfb5d46.pdf.↩
Mackenzie, A. (2017) Machine learners : archaeology of a data practice, Cambridge, Massachusetts, The MIT Press. fn p.142↩
Drucker, J. (2011) ‘Humanities Approaches to Graphical Display’, DHQ Digital Humanities Quarterly, vol. 5, no. 1 [Online]. Available at http://www.digitalhumanities.org/dhq/vol/5/1/000091/000091.html.↩
Drucker, J. (2014) Graphesis: Visual Forms of Knowledge Production., Harvard University Press.↩