Counting the Future
Minimum Viable Product, as presented on 01/09/2016 at the Counting by Other Means session (Kember and Taylor, 2016); 4S/EASST 2016 Science and Technology by Other Means Conference in Barcelona, Spain.
10 Apr. 2019: This article was previously hosted on Medium. I am moving it here so it can be self-hosted with the rest of my talks.
Introduction
Last June, an article in Wired magazine was titled:
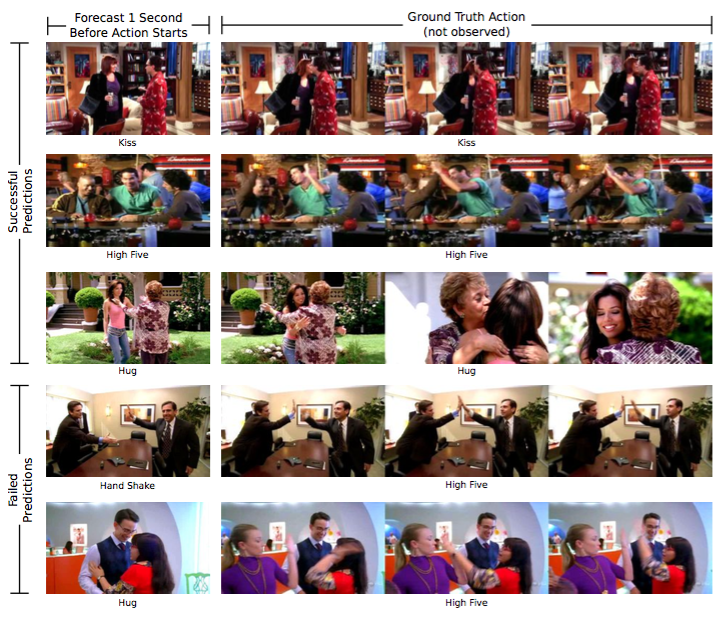
“This AI learned to predict the future from watching loads of TV”
This story was based on a computer vision study from MIT where machine learning was used to predict handshakes, hugs, kisses and high-fives in american sitcoms with 43% accuracy (Burgess, 2016).
 This is but one example of the current explosion in machine learning, which is currently transforming a huge variety of fields, and of the high expectations being set by headlines declaring that long lasting myths such as machine intelligence and precognition are finally becoming reality.
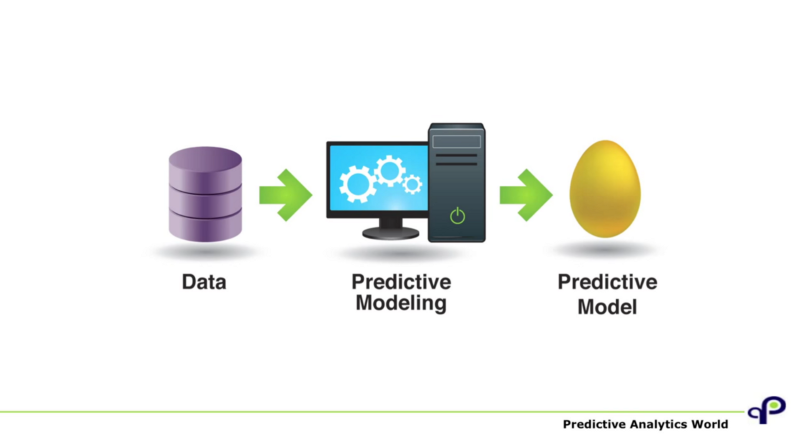
Machine learning, whether it is called ‘data science’ or ‘predictive analytics’, is currently at the centre of an imaginary where computers predict the future. As many of you will know, it promises everything from great profits, with Eric Siegel describing predictive models as ‘golden eggs’ — which don’t even have to be very good, as predictions just marginally better than random guesses will already pay off (Siegel, 2015)— to the obsolescence of the scientific method (Anderson, 2008).
‘Anticipatory Design’ proposes a user interface for the predictions of machine learning, or more accurately it proposes to remove as much of the interface as possible by making decisions for the user to erase the mountain of tedious choices out of modern daily life (Shapiro, 2015).

This project proposes to use design practice to critically examine computational prediction; to offer a counterpoint to anticipatory design by going back in time and looking at history. However groundbreaking the current moment is for computational prediction, it is the latest chapter in a long history of attempts to predict the future from data. Looking into this history might reveal some of the recurring narratives and aesthetics that define the systems that we find ourselves entangled in today. To do this I am building a visual history of prediction technologies; a web based index of attempts at predicting the future from data.
This paper is about the first ‘minimal viable product’ for this research tool and some of the things I am interested in finding out with it. It sets out some methods for a design-oriented investigation of computational prediction–ways to plot knowledge from the literature on the history of probability and statistics, borrowing methods from the digital humanities — and proposes some early findings, or hunches, about the narratives and aesthetics of predictions.
I. Methods
Rather than attempting to re-write an exhaustive history of prediction, which others have done very well (Porter, 1986; Gigerenzer et al., 1990; Daston, 1995), this project aims to contribute new ways of accessing this history by approaching it from a design perspective. Both the questions being asked, such as ‘how does prediction manifest itself aesthetically?’, and the methods used to address them are rooted in design practice. The ways in which we extract or ‘mine’ predictions from data is here both a subject to be critically examined and the means of an investigation to find ‘other means’ of ‘counting’ this history.
Artefacts as data points
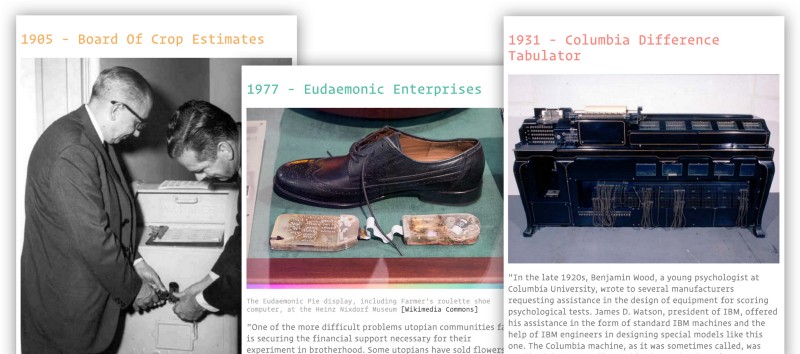
As a designer I aim to uncover the characteristics and aesthetics of prediction technologies through the study of artefacts. Presented here is a collection of objects and stories which embody specific attempts at predicting the future from data. They provide tangible glimpses into the long and intricate history of statistics, using “objects” as an entry point to “values” and “rules” (Gigerenzer et al., 1990). As objects of design, the artefacts in Counting the Future are selected for the connections they provide to the broader designs (as in motivations, politics and imaginaries) that they are shaped by.
Data Stories of Data
To experience the complications of ‘mining’ data for knowledge and patterns first hand, I am using a popular data-visualisation library, D3.js to draw chronological and narrative links between the artefacts. The visual language of data and statistics is used to tell the story of how they came to play such an important role in society.
This design process aims to surface some of the complications of computational prediction which are reflected in the practice itself. The problem of how to represent the complex web of technologies, politics and beliefs in which computational predictions exist raises issues familiar to the digital humanities, as described by Burdick et al.: “computation depends on disambiguation at every level, from encoding to the structuring of information. Explicit step-by-step procedures form the basis of computational activity. However, ambiguity and implicit assumptions are crucial to the humanities” (Burdick et al., 2012, p. 17).
The Timeline as ‘Crazy Wall’
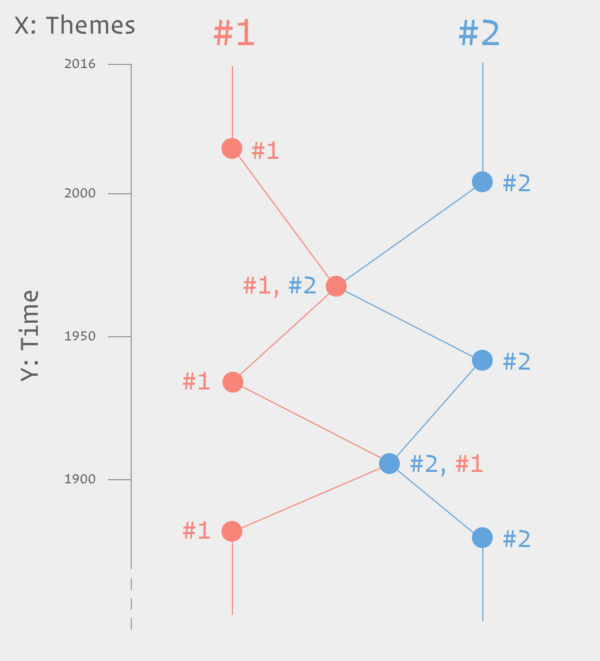
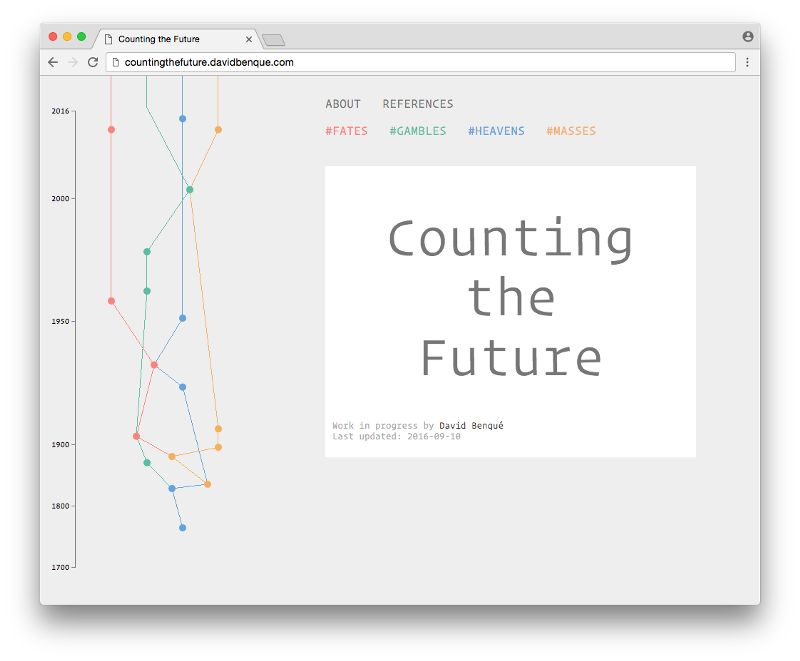
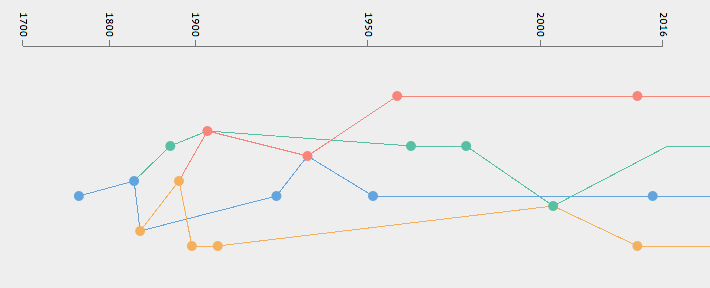
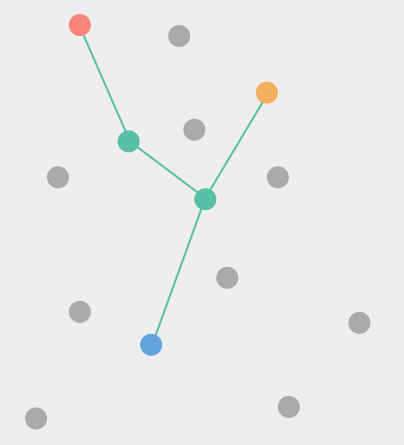
To address these challenges, I am working on the beginning of a visual language for the entangled trajectories of prediction. The artefacts are categorised into four narrative themes (see below) but can also be be assigned an additional theme to reflect analogies and influences gathered from the literature. When that is the case the two visual strands become visually connected creating a ‘knot’ in an otherwise linear and parallel timeline. This very rudimentary system is a first step towards presenting the history of prediction as complex and entangled rather than as a linear progression of technological capabilities.
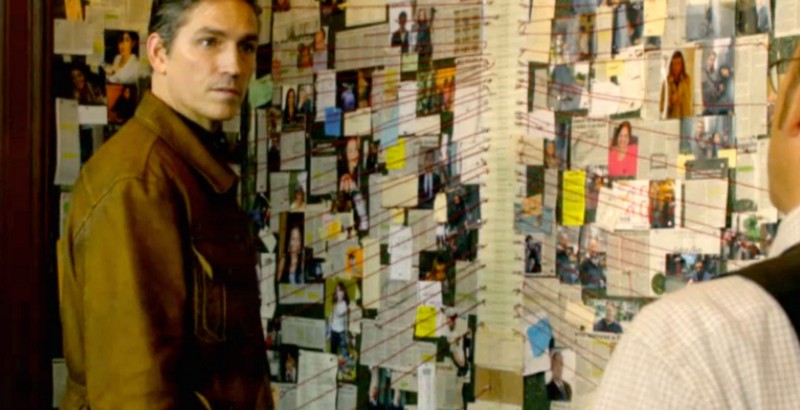
Visually, the result resembles the ‘crazy walls’ used as narratives devices in movies and TV series where a mystery or investigation needs to be solved (Benson, 2015). These boards or walls are used by protagonists, usually detectives, to gather evidence and draw links between suspects as the plot progresses. This also reflects my process as a designer venturing in to the world of technology studies and the history of science, with the difference that I never expect to find whodunnit; the crazy wall here is an end in itself.
II. Narratives and Aesthetics
This project aims to contribute more than a catalog of artefacts as proofs that attempts to predict the future from data are numerous and diverse. I aim to draw on these examples to reveal some of the characteristics and aesthetics of prediction.
1) Themes
I have identified four themes as an initial classification. They are both physical scales and narrative arcs which run through the history of prediction: the cosmos, the market, society and the body. There is no time to go into detail here so I will only give a quick overview of them:
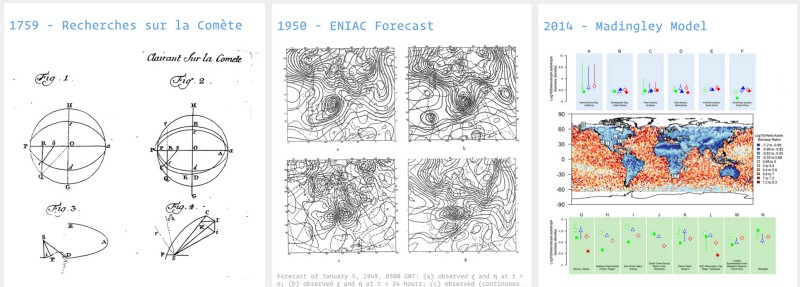
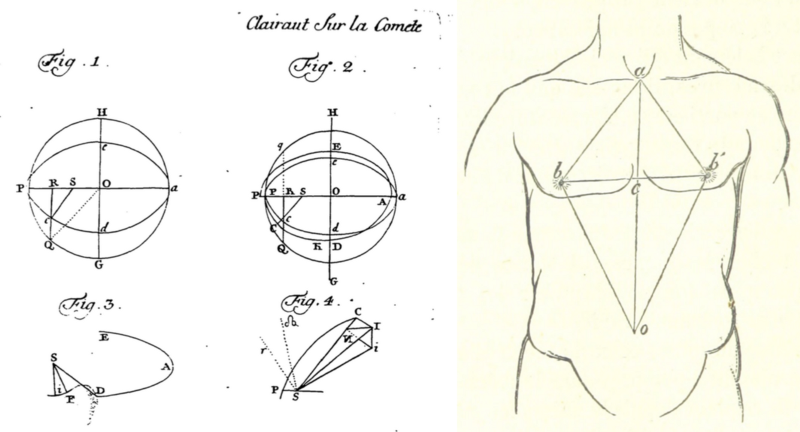
#HEAVENS Cosmic truths and atmospheric forecasts
This theme starts at the origins of scientific prediction with the plotting of planetary orbits from observations, for example the predictions that comet Haley would return in 1759 (Broughton, 1985). It extends through the history of weather forecasting, a poster story of prediction, to today’s climate and ecosystem models (Edwards, 2010).
#GAMBLES Market speculations: bets, bluffs, corners.
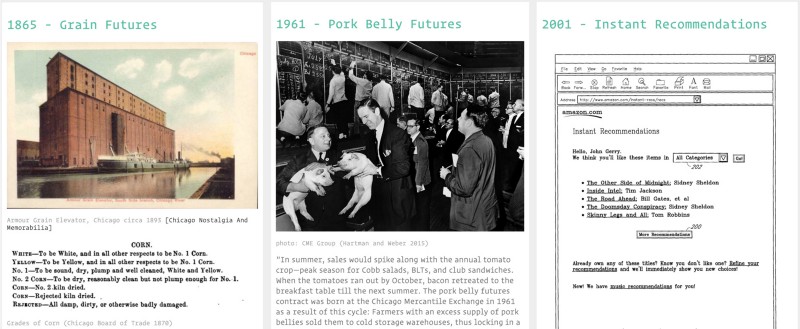
The second theme looks at tensions between gambling and economics, as futures became an object of trade. It starts with Chicago’s grain futures market at the end of the 19th century (Cronon, 1991), and continues through the explosion in derivatives trading (D. Mackenzie, 2008) and the high frequency trading we know today. ‘Bets’ about what a customer might want, such as targeted advertising and algorithmic recommendations (Seaver, 2012), are also filed under this category.
#MASSES Social order and public opinion
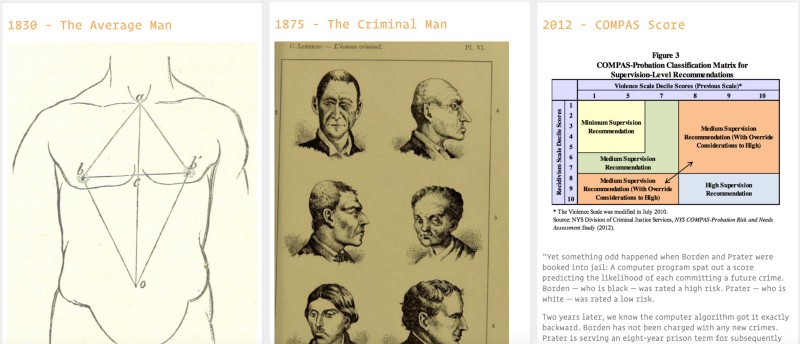
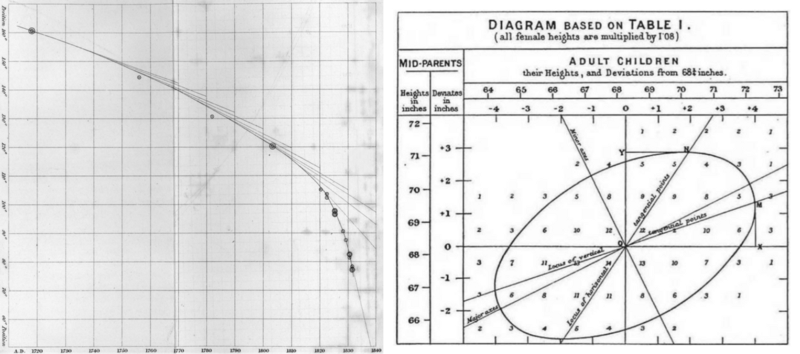
This theme is about attempts to understand: 1) what society is: a galaxy, as suggested by Quetelet’s Average Man? (Gigerenzer et al., 1990, p. 40) or an organism, following Galton’s analogy between gemmules (an early name for genes) and voters in a constituency? (p.55) and 2) what it wants, for example through political polls and the notion of ‘public opinion’ (Lepore, 2015); in the hope to iron out outliers and imperfections such as criminals (Gibson, 2002; Harcourt, 2006).
#FATES Cell fates and individual destinies
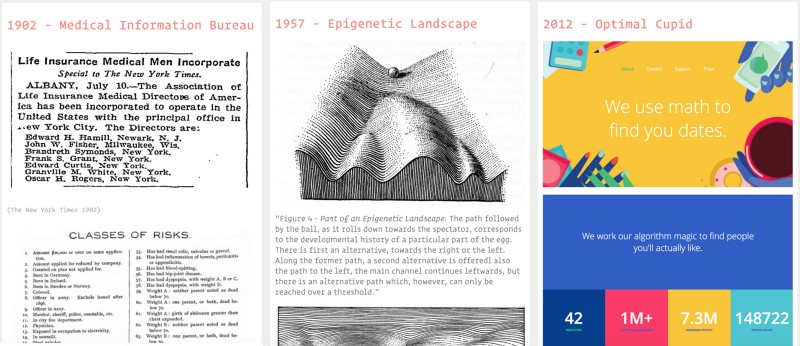
Finally, the last theme is about biological notions of predestination. It starts with the 19th century life insurance industry (Bouk, 2015) and continues with genetics and cracking the ‘code of life’, attempts to unlock the secrets of the brain, predicting romantic attraction, and so on.
General Laws of Motion
The themes work as individual narratives but overlaps and intersections surface when they are taken as a series. I am highlighting these with the rudimentary visual system shown above.
They reveal that the history of prediction is one of analogies and translations where theories and formulas developed to solve a specific problem in one field, such as predicting the position of a star in astronomy, were then used in a completely different context such as predicting crime in society; as in Adolphe Quetelet’s ‘Average Man’: “The average man was invented as a tool of social physics, and was designed to facilitate the recognition of laws analogous to those of celestial mechanics in the domain of society.” (Gigerenzer et al., 1990, p. 40).
The fact that identical mathematical methods are applied to a wide variety of different domains stands out as key characteristic of computational prediction. Coming back to machine learning, Mackenzie talks about “a generalization of prediction […] woven into the fabric of everyday life.” (A. Mackenzie, 2015, p. 430). On top of the specific narratives in the themes above, the overarching idea is that the same general laws of motion govern the cosmos, markets, society and bodies, and that these can be accessed through universal and interchangeable mathematics.
2) The Aesthetics of Accuracy
Coming back to my design focus, I’m interested in how these universal mathematics, or ‘codes’, of prediction are represented. They are numbers first and reflect “the fascination with the numerical and the longing for certainty that the numerical symbolizes, preconditions for the remarkable success of the mathematics of uncertainty.” (Gigerenzer et al., 1990, p. 237), but they are also inherently visual.
Visual Codes
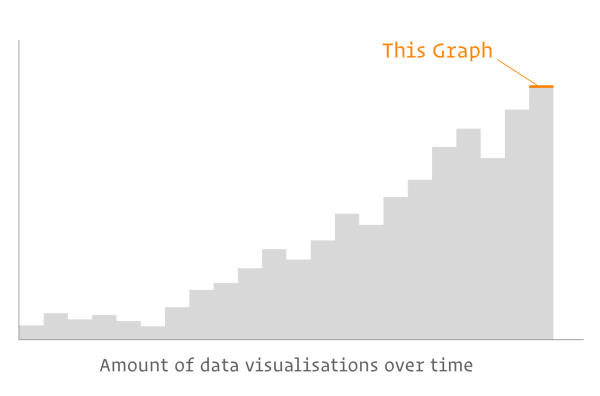
The rise of probability and statistics in the second half of the 19th century coincides with a “golden age of statistical graphics” (Friendly, 2008), an explosion in the types and numbers of charts, graphs and plots. These were not just illustrations to communicate numbers but a key element in the production of predictions. From a graphic design perspective, the history of prediction can be summarised as a long quest to draw smooth curves through noisy data points and to reveal patterns through plotting.
The Legitimacy of Codes
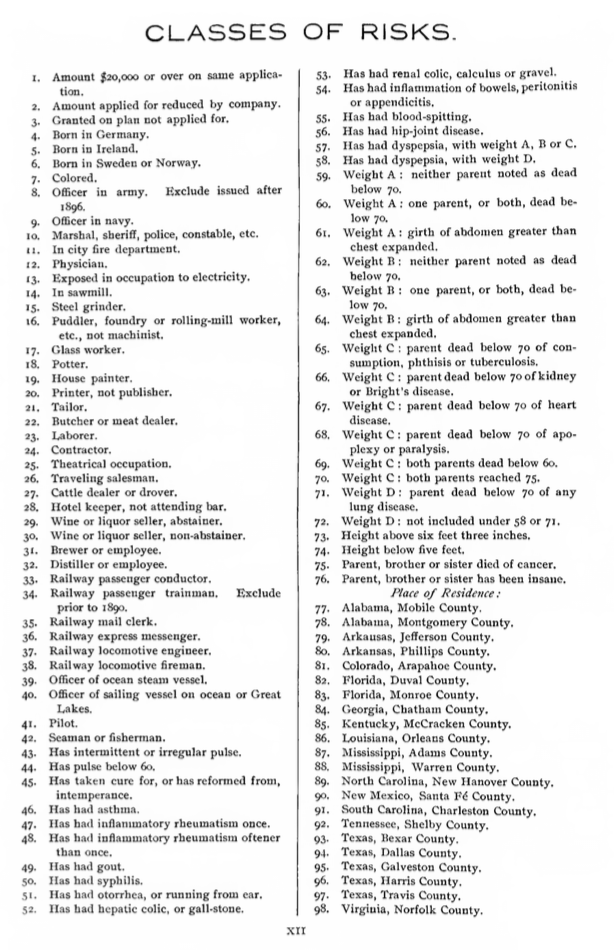
Aside from the graphical aspects of mathematics, the aesthetics of accuracy also legitimise predictions and its codes. Just like economics borrowed legitimacy from astronomy in the 19th century by using its rigorous mathematics (Ashworth, 1994), the codes of prediction lend the appearance of the general laws of motion to political projects; for example this classification of risks for insurance from 1903 includes skin colour, profession, place of birth or residence and profession as risks:
Today’s predictions continue to rely on this legitimacy, implying the general laws of motion through processes of codification. For example finding a romantic match on OkCupid or determining wether a suspected criminal is likely to offend again using the COMPAS score both rely on lengthy questionnaires.
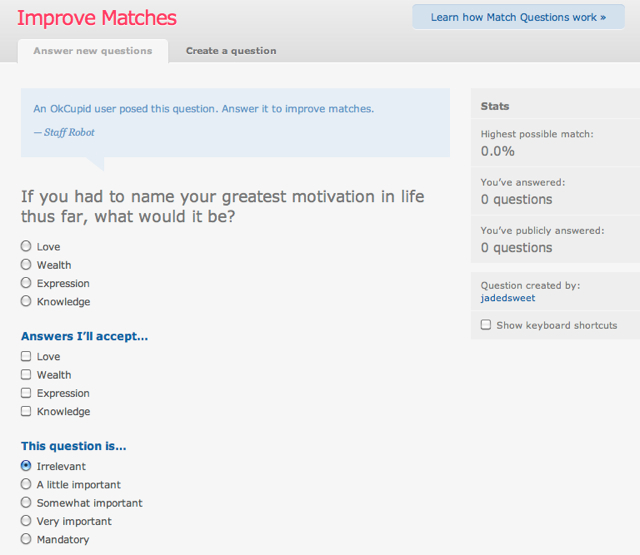
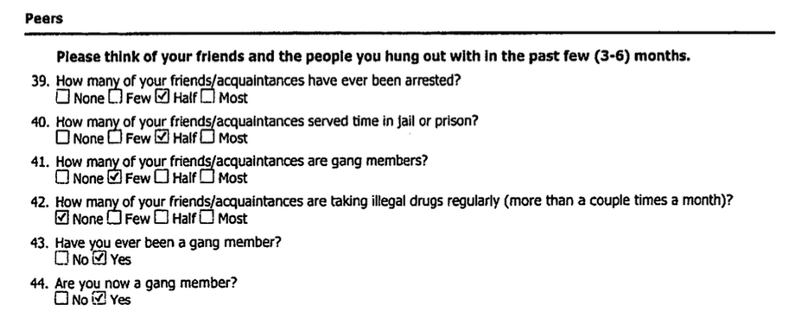
On the face of it, agency is transferred from user to machine through a simple sequence of input > submit > black box > score. The aesthetic of interaction is more of a mutual production of the count where the agency oscillates back and forth between user and machine. This process gradually suspends disbelief so that when the score comes out it is the product of both the specific user and the general laws of motion.
The Befuddled Many
We have seen some of the ways in which the aesthetics of accuracy communicate predictions, but they are as much defined by their opacity than by their appearance. Sandvig writes about the ambiguity of the term ‘algorithm’ and the ways in which ‘the sort’ is represented and absented “cloaked by the legal protections of intellectual property and corporate personhood” and about the need for a “countervisuality” of algorithms to address this opacity, and open up the count for scrutiny (Sandvig, 2014). Sandvig, as well as Pasquale’s Black Box Society, both respond to the sense of befuddlement about what comes to count in the computation of prediction.
This is interesting because befuddlement and uncertainty is exactly what statistics and predictions set out to reduce in the first place:
“Only a small elite of hommes éclairés could reason accurately enough by unaided intuition; the calculus of probabilities sought to codify these intuitions (which the probabilists believed to be actually subconscious calculations) for use by hoi polloi not so well endowed by nature. This mathematical model of good sense could be compared to spectacles. By applying the same optical principles responsible for normal eyesight it was possible to extend vision artificially; similarly, the calculus of probabilities formalized the good sense that came naturally to the fortunate few to help out the befuddled many. ”(Gigerenzer et al. 1990 p.16)
Although this quote refers to the enlightenment and what Daston calls ‘Classical Probabilities’ (1995), it resonates with some of the aesthetics of computational prediction today, such as Anticipatory Design’s mission to help out users of technology crawling under “decision fatigue” by making decisions for them (Shapiro op. cit.).
It poses a question that could be asked about today’s systems of prediction: who are the fortunate few and the befuddled many? In the case of Google Now (pictured), there seems to be a simple answer that the fortunate few are ‘affluent white males’ in silicon valley (Clark 2016) helping out the befuddled rest of us. In other cases such as the COMPAS score, befuddlement seems distributed in more complex ways, since the score is provided by a third party (Northpointe Inc, 2016) the suspected criminal and the judge are both part of the befuddled many; in different ways and of course with very different consequences. As I attempt to map out this space I definitely count myself as part of the befuddled many.
Conclusion
I hope to have given you an overview of some of the hunches I will work to substantiate in the coming months and of the ways design practice can be used to approach prediction and its complications from another angle. There are still many dots to be connected on the timeline which as of now counts 18 artefacts. Work in the coming months will involve adding more artefacts, identifying more knots between the themes, and developing the visual language. One feature in development is the possibility to highlight more specific narratives and transitions, rather than link all artefacts by default.
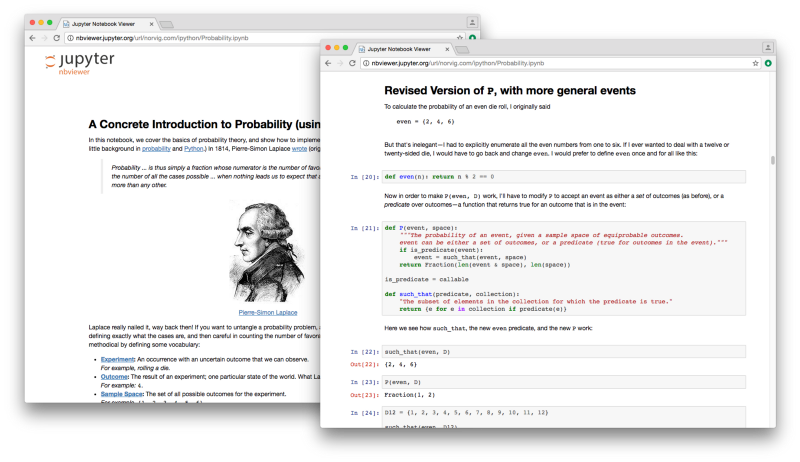
As part of my practice-based phd project as a whole, Counting the Future is Phase 1 of 3. The next phase will be to experiment and manipulate these aesthetics of accuracy ‘hands on’. One format for doing this might be the iPython notebook which allows for executable code to be mixed with text and images. Peter Norvig uses this format to reimplement some of the classical examples of probability in Python (Norvig, 2016).
I wonder how re-enacting historical theories such as Quetelet’s Average Man with today’s tools such as iPython would bring out differences but also similarities with today’s imaginaries of prediction.
I welcome any questions, comments or feedback, especially as this my first time presenting this work. So feel free to get in touch or to view the timeline here: countingthefuture.davidbenque.com .
(as the site is likely to change, code a the time of writing from which screenshots in this document are taken is accessible here: https://github.com/davidbenque/Counting-the-Future/releases/tag/4S%2FEASST2016)
This project is part of my PhD research in Information Experience Design at the Royal College of Art in London. This work is supported by Microsoft Research Cambridge through its PhD Scholarship Programme.
References
Anderson, C. (2008) The end of theory: the data deluge makes the scientific method obsolete., Wired. Available at: http://www.wired.com/2008/06/pb-theory/ (Accessed: 2 December 2015).
Angwin, J., Mattu, S., Larson, J. and Kirchner, L. (2016) Machine Bias, Propublica, 23 May. Available at: https://www.propublica.org/article/machine-bias-risk-assessments-in-criminal-sentencing (Accessed: 12 July 2016).
Ashworth, W. J. (1994) ‘The calculating eye: Baily, Herschel, Babbage and the business of astronomy’, The British Journal for the History of Science, 27(04), pp. 409–441. doi: 10.1017/S0007087400032428.
Benson, R. (2015) Decoding The Detective’s “Crazy Wall”, Esquire.co.uk, 23 January. Available at: http://www.esquire.co.uk/culture/film/news/a7703/detective-show-crazy-walls/ (Accessed: 5 August 2016).
Bouk, D. (2015) How Our Days Became Numbered. University of Chicago Press.
Broughton, P. (1985) ‘The first predicted return of comet Halley’, Journal for the History of Astronomy. Available at: http://articles.adsabs.harvard.edu/cgi-bin/nph-iarticle_query?1985JHA....16..123B&data_type=PDF_HIGH&whole_paper=YES&type=PRINTER&filetype=.pdf.
Burdick, A., Drucker, J., Lunefeld, P., Presner, T. and Schnapp, J. (2012) Digital Humanities. Cambridge MA, London England: MIT Press.
Burgess, M. (2016) This AI learned to predict the future by watching loads of TV, Wired, 22 June. Available at: http://www.wired.co.uk/article/algorithm-watch-tv-predict-future (Accessed: 26 August 2016).
Cronon, W. (1991) ‘Trading the Future: Grain’, in Nature’s Metropolis.
Daston, L. (1995) Classical Probability in the Enlightenment. Princeton University Press.
Edwards, P. N. (2010) A Vast Machine. MIT Press.
Friendly, M. (2008) ‘The Golden Age of Statistical Graphics’, Statistical Science, 23(4), pp. 502–535. doi: 10.1214/08-STS268.
Gibson, M. (2002) Born to crime. Praeger.
Gigerenzer, G., Porter, T., Swijtink, Z., Daston, L., Beatty, J. and Kruger, L. (1990) The Empire of Chance. Cambridge University Press.
Harcourt, B. E. (2006) Against Prediction: Profiling, Policing, and Punishing in an Actuarial Age. The University of Chicago Press.
Kember, S. and Taylor, A. (2016) 4S Preview: Counting by Other Means, 4sonline.org, 4 August. Available at: http://www.4sonline.org/blog/post/4s_preview_counting_by_other_means (Accessed: 10 August 2016).
Lepore, J. (2015) ‘Are Polls Ruining Democracy?’, The New Yorker, 16 November. Available at: http://www.newyorker.com/magazine/2015/11/16/politics-and-the-new-machine.
Mackenzie, A. (2015) ‘The production of prediction: What does machine learning want?’, European Journal of Cultural Studies, 18(4–5), pp. 429–445. doi: 10.1177/1367549415577384.
Mackenzie, D. (2008) An Engine, Not a Camera. MIT Press.
Northpointe Inc (2016) COMPAS Core. Available at: http://www.northpointeinc.com/products/core (Accessed: 12 September 2016).
Norvig, P. (2016) A Concrete Introduction to Probability (using Python), Jupyter nbviewer, 12 February. Available at: http://nbviewer.jupyter.org/url/norvig.com/ipython/Probability.ipynb (Accessed: 27 April 2016).
Porter, T. M. (1986) The Rise of Statistical Thinking, 1820–1900. Princeton University Press.
Sandvig, C. (2014) ‘Seeing the Sort: The Aesthetic and Industrial Defense of “The Algorithm”’, Media-N. Available at: http://median.newmediacaucus.org/art-infrastructures-information/seeing-the-sort-the-aesthetic-and-industrial-defense-of-the-algorithm/.
Seaver, N. (2012) ‘Algorithmic recommendations and synaptic functions’, Limn, (2).
Shapiro, A. (2015) The Next Big Thing In Design? Less Choice, fastcodesign.com, 15 April. Available at: https://www.fastcodesign.com/3045039/the-next-big-thing-in-design-fewer-choices (Accessed: 28 August 2016).
Siegel, E. (2015) How Predictive Analytics Delivers on the Promise of Big Data, 23 January. Available at: https://www.youtube.com/watch?v=CtNCuL39AWo (Accessed: 10 March 2016).
Vondrick, C., Pirsiavash, H. and Torralba, A. (2015) ‘Anticipating the future by watching unlabeled video’, arXiv.org.